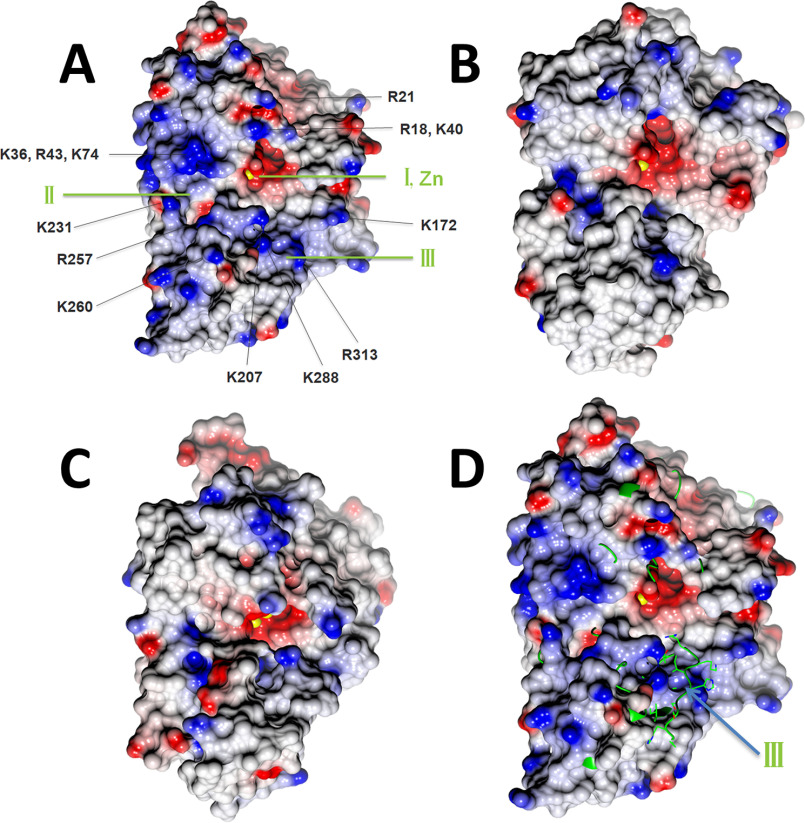
Figure 5.
Surface representation with electrostatic potential distribution of SNM1 family members in the same orientation. Metal ions at the active site are drawn as yellow spheres. A, Artemis/SNM1C oriented with pockets I, II, and III visible; note the abundance of (blue) positively charged residues in the vicinity of the catalytic site that may contribute to DNA substrate binding. B, SNM1A. C, SNM1B/Apollo. D, Artemis is shown as a surface model, and SNM1B/Apollo is shown as a yellow ribbon and cylinder (for side chain of region 259–268). In SNM1B/Apollo, pocket III is not open and is instead occupied by loop 259–268. The color intensity corresponds to the calculated electrostatic potential, from −20 kT/e (red) to +20 kT/e (blue).

