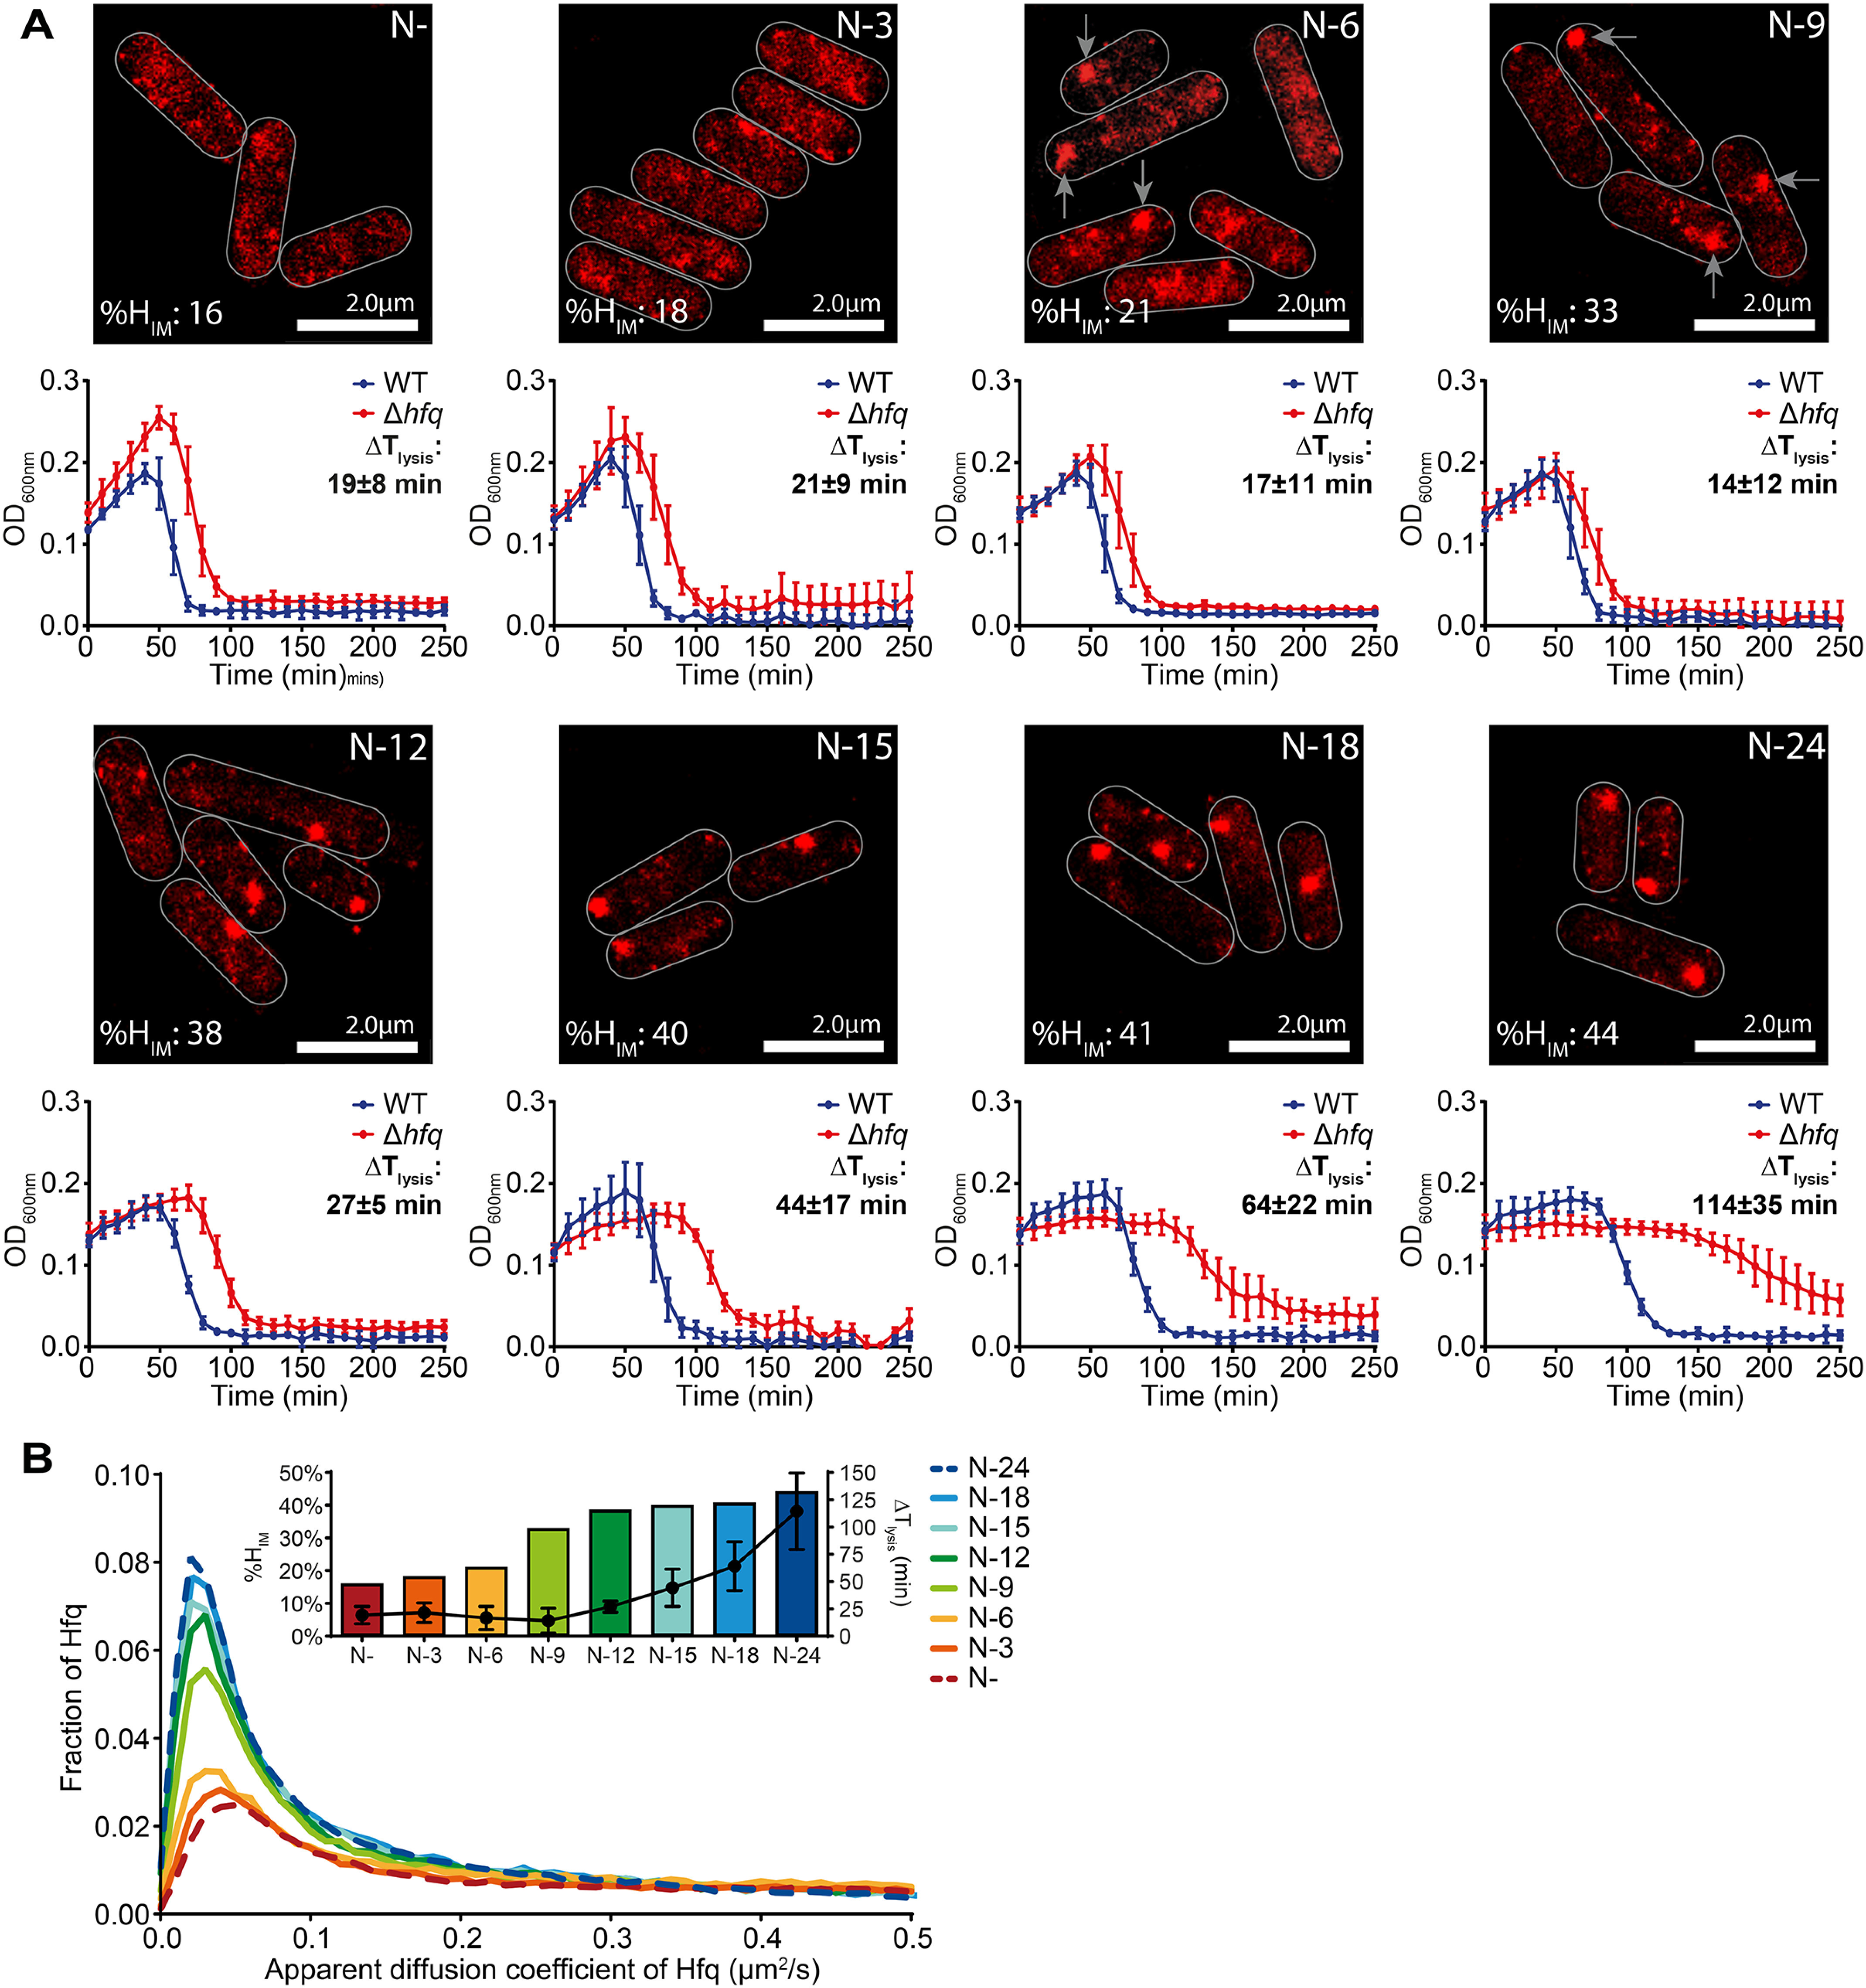
Figure 4.

Hfq foci formation contributes to adapting E. coli cell function as N starvation ensues. A, representative PALM images of Hfq in E. coli cells as a function of time under N starvation (top panels). Images were taken at the indicated time points, and the arrows point to the Hfq foci. The images for N− and N–24 have been reused from Fig. 3 (B and C), respectively, to allow direct comparison. Graphs (bottom panels) with the optical density (A600 nm) as a function of time of WT and Δhfq E. coli cells following infection with T7 phage are shown below each corresponding PALM image. The difference in time taken for the A600 nm of the culture to decrease by ∼50% (Tlysis) between WT and Δhfq is indicated (ΔTlysis). B, graphs showing the distribution of apparent diffusion coefficient of Hfq molecules at the different sampling time points and the corresponding %HIM and ΔTlysis values are shown in the inset (see text for details).
