Figure 6.

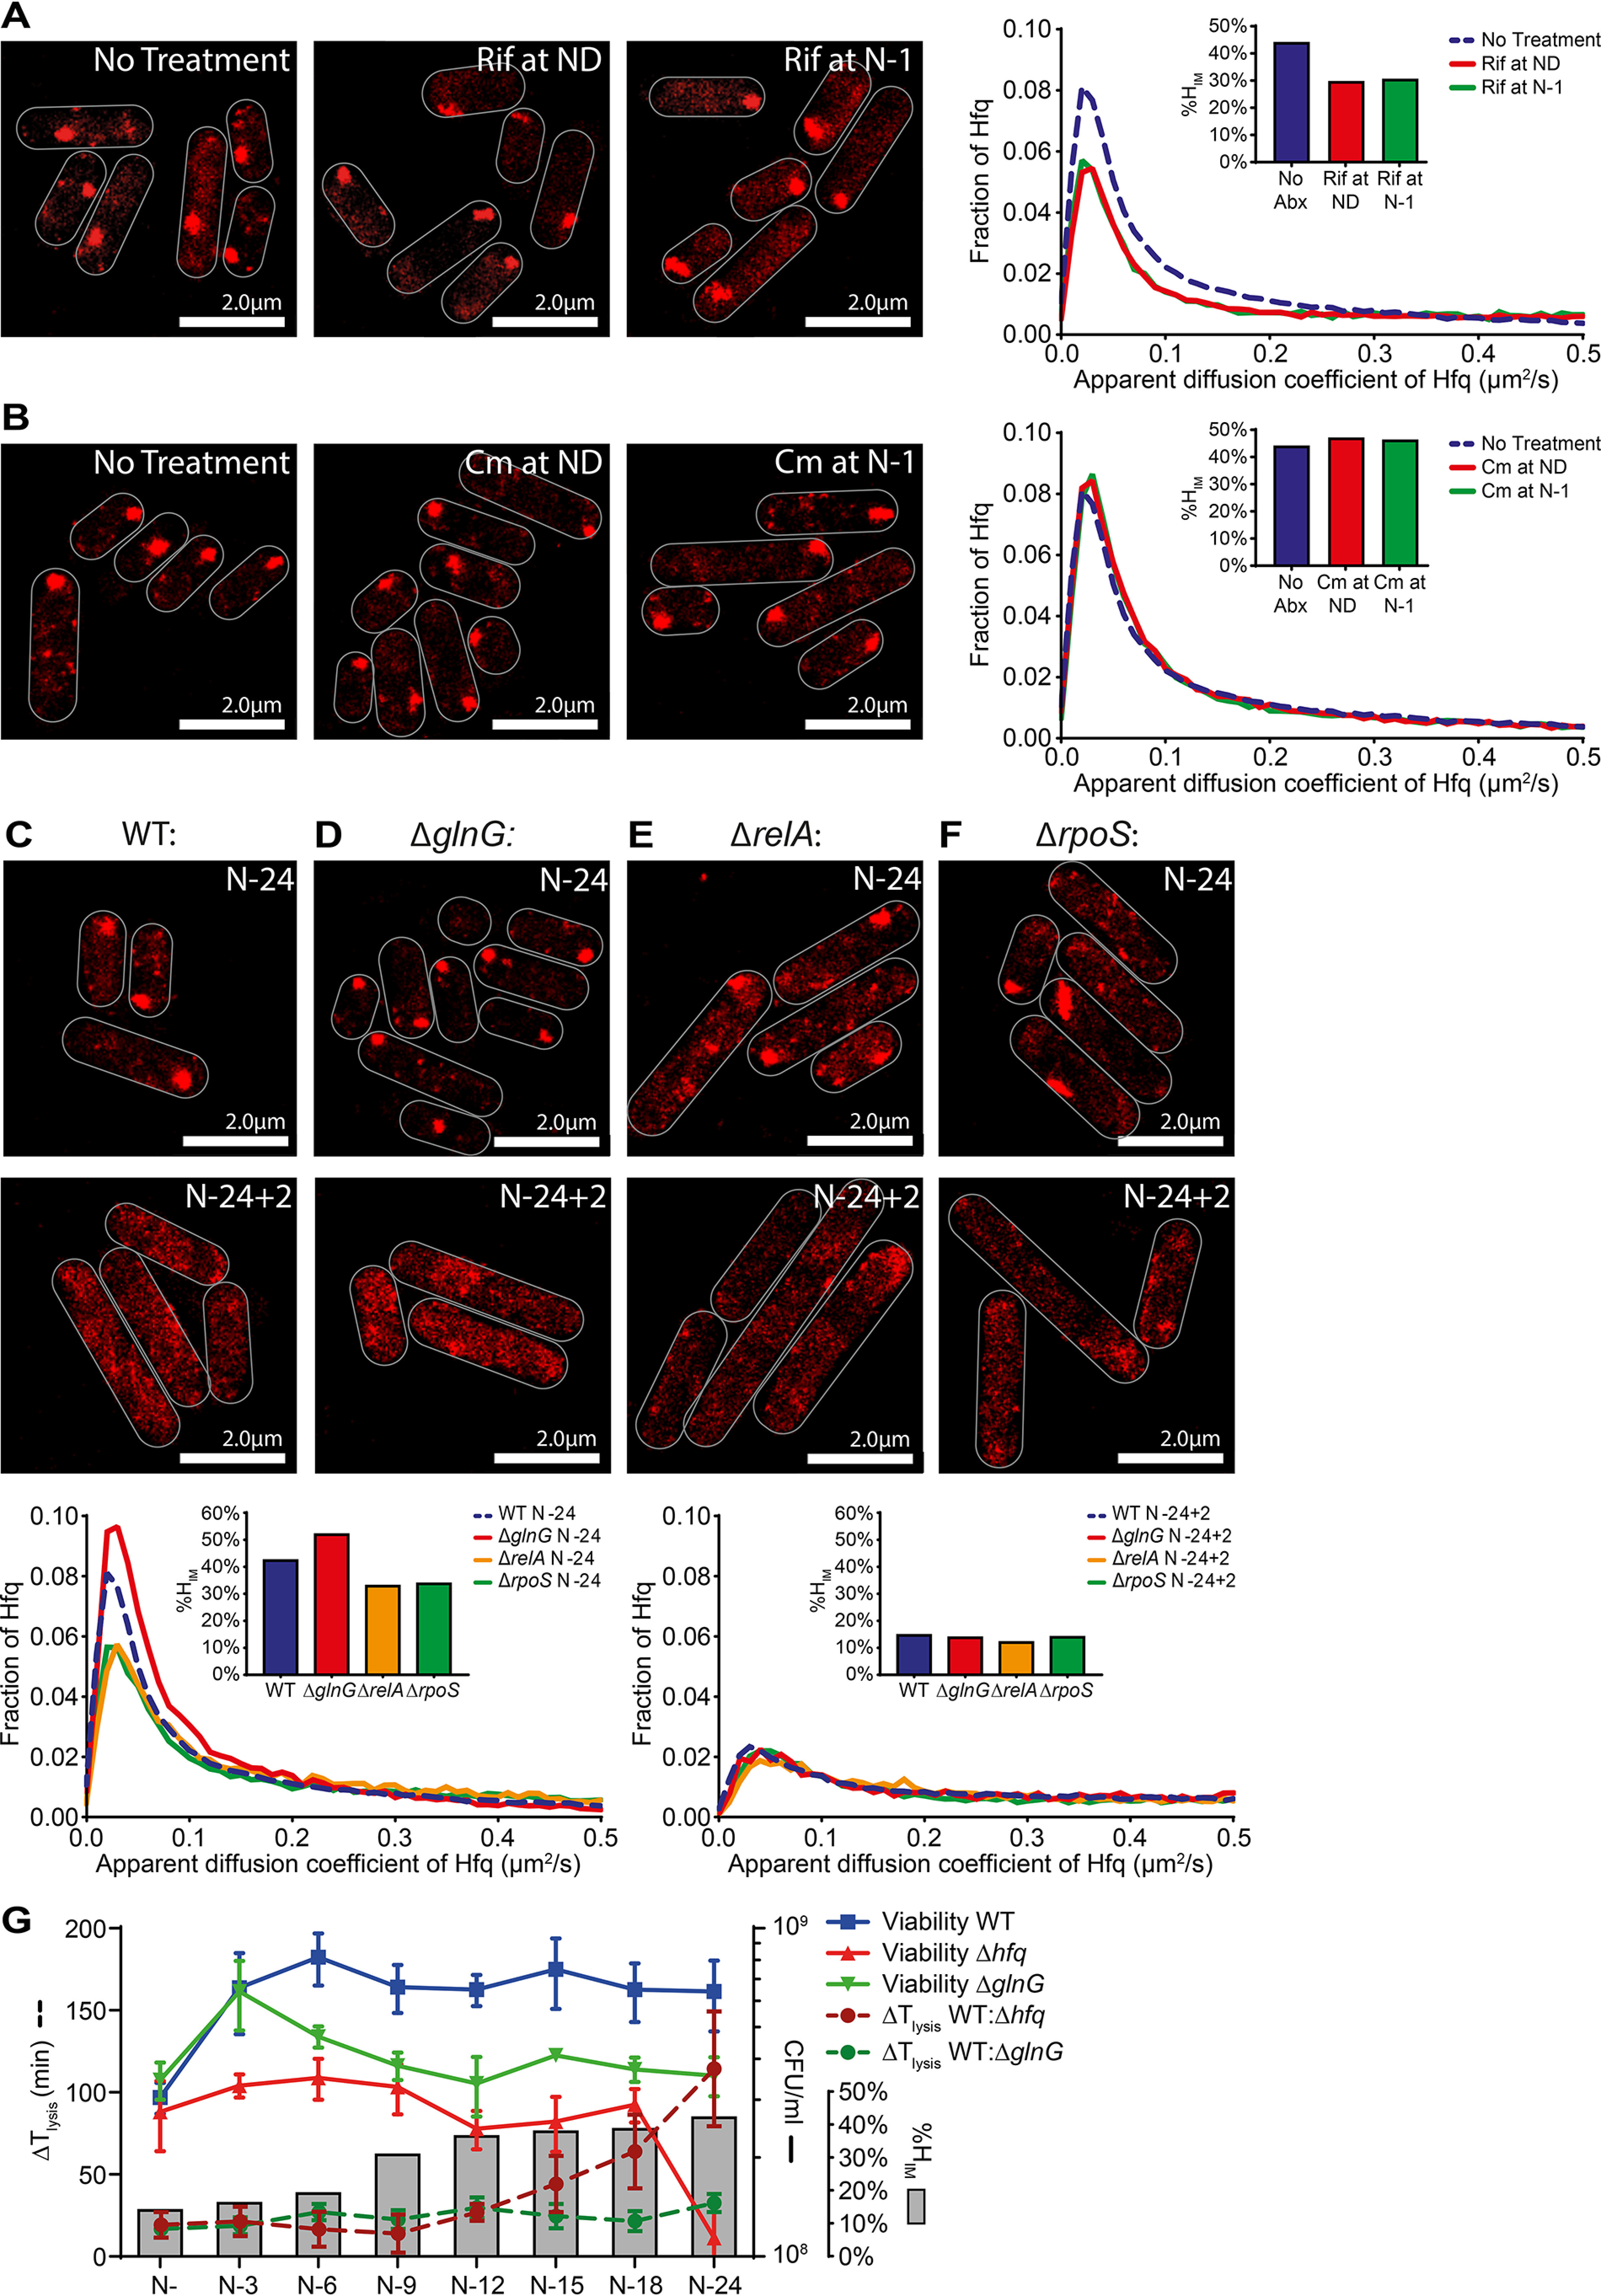
Hfq foci formation occurs independently of the Ntr response in long-term N-starved E. coli. A, representative PALM images of Hfq in E. coli cells treated with rifampicin (Rif, 100 μg/ml) at ND (middle panel) and 1 h following onset of N starvation (N-1) (right panel) and imaged at N–24. The untreated bacteria from N–24 are shown for comparison (left panel). The inset graph shows the distribution of apparent diffusion coefficient of Hfq molecules and corresponding %HIM values. B, as in A but 150 μg/ml of chloramphenicol (Cm) was used. C–F, representative PALM images of Hfq in E. coli cells in WT (C), ΔglnG (D), ΔrelA (E), and ΔrpoS (F) strains at N–24 and 2 h (N–24 + 2) following alleviation of N starvation stress (as in Fig. 5A). The N–24 image for WT has been reused from Fig. 3C to allow direct comparison. The graphs show the distribution of apparent diffusion coefficient of Hfq molecules and the %HIM values at the sampled time points. G, graph showing the viability of WT, Δhfq and ΔglnG E. coli during long-term N starvation measured by counting CFU, ΔTlysis values of Δhfq and ΔglnG relative to WT at each sampling time point, and the corresponding %Him values of WT bacteria at each sampling time point.
