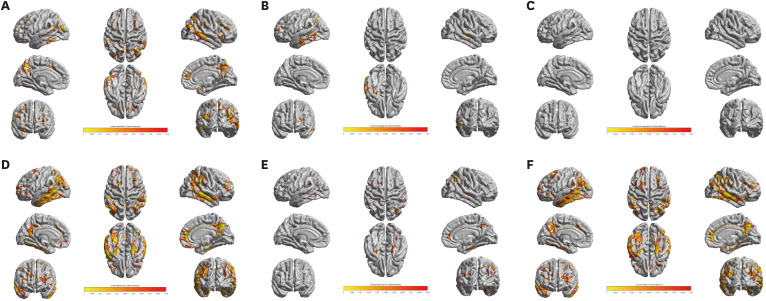
Fig. 2. Cortical thinning pattern correlated with the cognitive domain scores of Inbrain CST. The q value denotes the FDR-corrected P value. (A) Attention domain score. (B) Language domain score. (C) Visuospatial function domain score. (D) Memory domain score. (E) Executive function domain score. (F) Total score.
CST = Cognitive Screening Test, FDR = false discovery rate.

