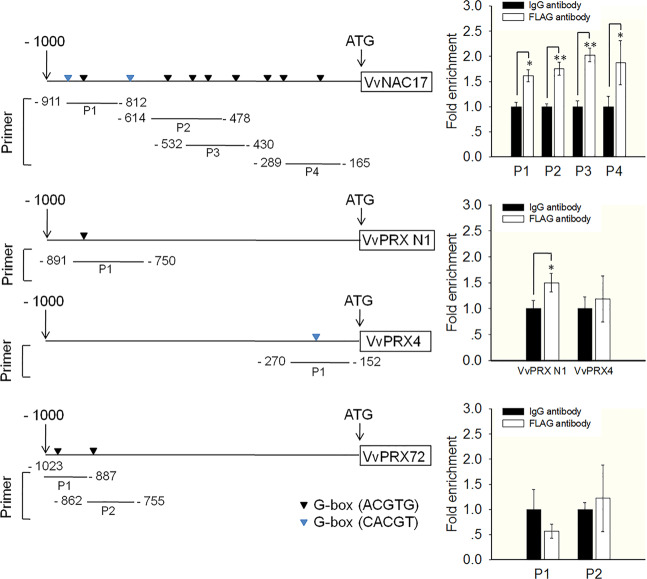
Fig. 7. Chromatin immunoprecipitation (ChIP)-qPCR showing VlbZIP30 interacting with the promoters of four target genes involved in drought stress or lignification.
Left, schematic diagram of different PCR-amplified regions used for the ChIP-qPCR assay. Right panel, relative fold enrichment of ChIP-qPCR data showing each PCR amplification region of each gene. An IgG antibody was used as a negative control. The ChIP signal was quantified as the percentage of immunoprecipitated DNA in the total input DNA, and the fold changes were calculated based on the relative enrichment in anti-Flag-VlbZIP30 compared with anti-IgG immunoprecipitates. Data are shown as the means ± SEs of three technical replicates. Asterisks indicate statistical significance (*0.01 < P < 0.05, **P < 0.01, Student’s t test)

