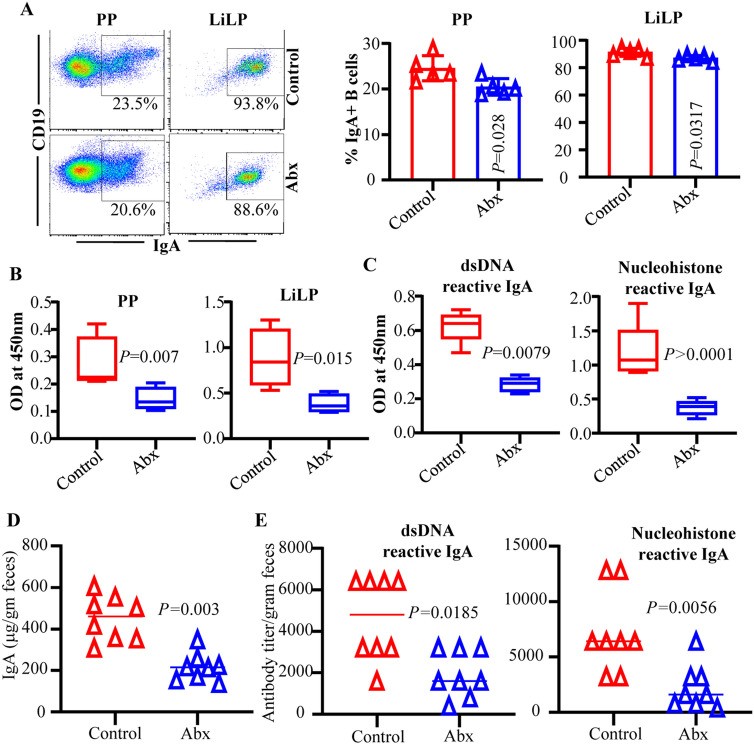
Figure 6.
Fecal IgA abundance and nAg reactivity in microbiota depleted mice. SNF1 females were left untreated or given broad spectrum antibiotic cocktail to deplete the gut microbiota as depicted in supplemental Fig. 2A. Microbiota depletion efficacy and proteinuria monitoring data are shown in supplemental Fig. 2B and 2C. (A) PP and LiLP cells from these mice at 16 weeks of age were subjected to FACS after staining using anti-mouse CD19 and IgA antibodies as described for Fig. 1. Representative FACS plots (left) and mean ± SD values (5 mice/group) of IgA + B cell frequencies (right) are shown. (B) PP cells and immune cell rich fractions of LiLP were cultured (2 × 10yy6 cells/ml) for 48 h in the presence of bacterial LPS and anti-CD40 antibody. Supernatants were tested for total IgA levels by ELISA. (C) Supernatants of LiLP cultures were tested for dsDNA and nucleohistone reactive IgA levels by ELISA. Mean ± SD of OD values (5 mice/group) are shown in panels (B–E) Fecal pellets from another cohort of control and microbiota depleted mice (20 weeks of age) were subjected to ELISA to determine the total IgA, and dsDNA and nucleohistone reactive IgA levels. Mean ± SD of OD values (8 mice/group) are shown. P-value by Mann–Whitney test.

