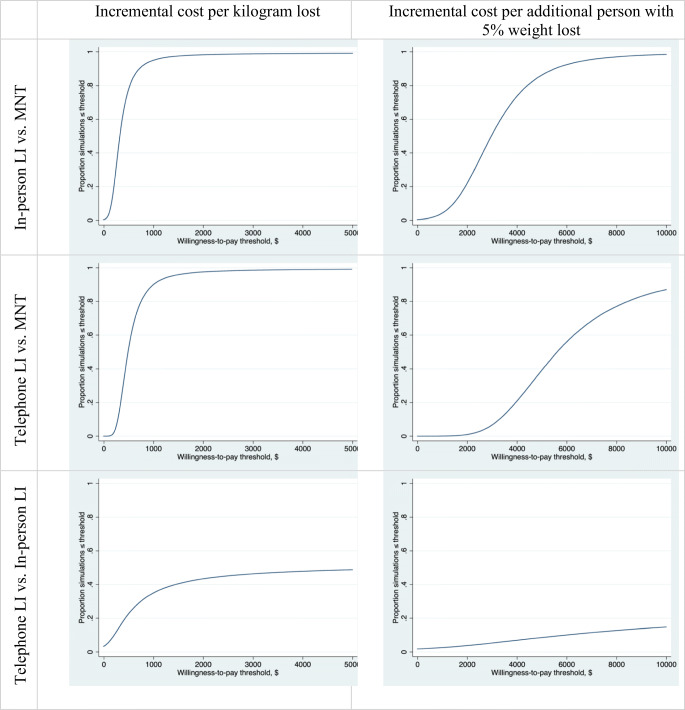
Figure 3.
Cost-effectiveness acceptability curves for comparisons across study arms. Likelihood (y-axis) that the first arm would be preferred to the second arm at a given willingness-to-pay threshold (x-axis). Estimates based on 100,000 simulations. LI, lifestyle intervention; MNT, medical nutrition therapy.

