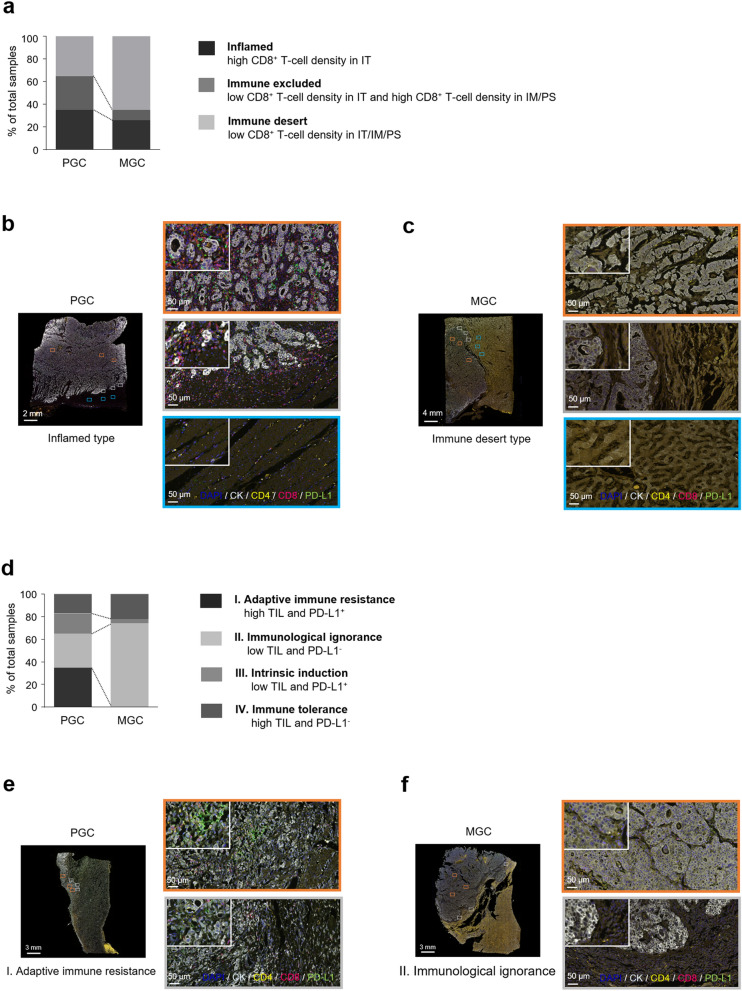
Figure 2.
Comparison of tumor immune microenvironment types between PGC and MGC. (a) Comparison of types based on CD8+ T-cell density and the distribution between PGC and MGC. (b) Representative multiplex IHC images of a PGC specimen with inflamed type (high CD8+ T-cell density in the IT region). (c) Representative multiplex IHC images of paired MGC specimens with immune desert type (low CD8+ T-cell density in the IT, IM, and PS regions). (d) Comparison of types based on T-cell density and PD-L1 expression in the IT and IM regions between PGC and MGC. (e) Representative multiplex IHC images of PGC specimens with adaptive immune resistance type (high CD4+ + CD8+ T-cell density and PD-L1-positive). (f) Representative multiplex IHC images of paired MGC specimens with immunological ignorance type (low CD4+ + CD8+ T-cell density and PD-L1-negative). PGC primary gastric cancer, MGC metastatic gastric cancer, IHC immunohistochemistry, IT intratumoral, IM invasive margin, PS peritumoral stroma, PD-L1 programmed death-ligand 1, CK cytokeratin.

