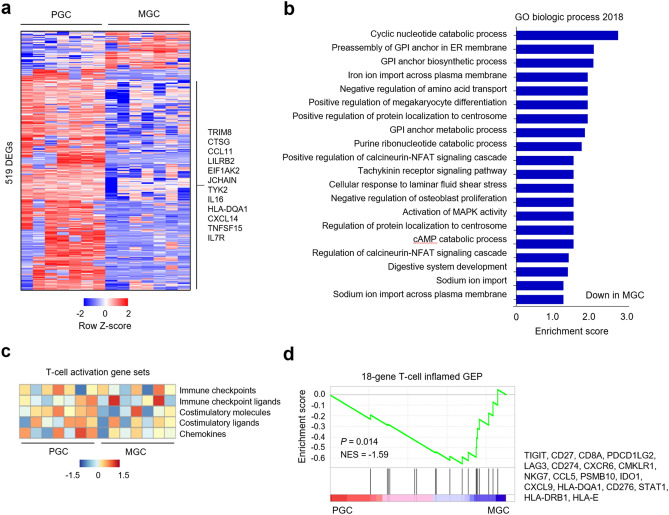
Figure 3.
Immune-related gene expression profiles. (a) Heat map of 519 differentially expressed genes (DEGs; P < 0.05 and fold change > 2). (b) Gene ontology analysis of the DEGs. (c) Gene Set Validation Analysis to assess the enrichment of gene sets related to immune checkpoints, immune checkpoint ligands, co-stimulatory molecules, co-stimulatory ligands, and chemokines. (d) Gene Set Enrichment Analysis to assess the enrichment of 18-gene T-cell inflamed gene expression profiles. PGC primary gastric cancer, MGC metastatic gastric cancer, NSE normalized enrichment score, GEP gene expression profile.

