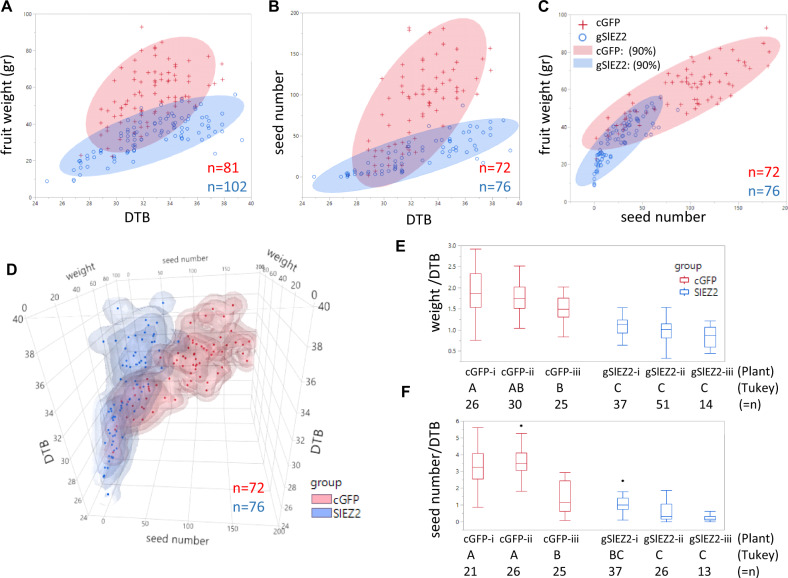
Fig. 2. Fruit measurements of SIEZ2 and control cGFP plants.
a–c Bivariate normal density ellipse plot of two groups, each consists of three stably transformed plants, of the control cGFP plants (red), and SIEZ2 plants (blue), showing the relations of fuit weight/DTB (a), seed number/DTB b, and fruit weight/seed number (c). d Three-dimensional graph of fuit showing the ratio of fruit weight to DTB (e) and seed number to DTB (f) of the individual plants within each group. Below each plot unmatching letters represent significant difference between the plants using Tukey’s HSD test (α 0.01). n represents the number of fruits tested.

