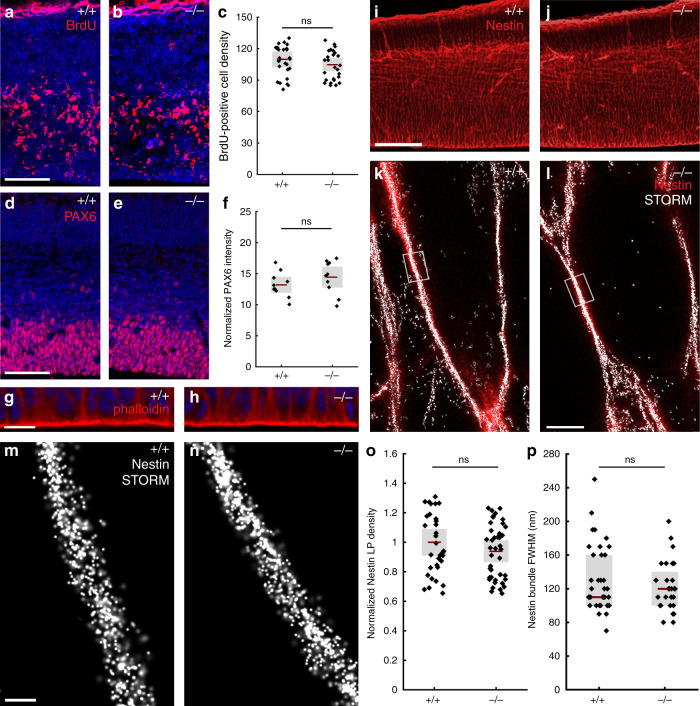
Fig. 4. ABHD4 is not required for classical radial glia progenitor cell functions.
a, b Coronal sections of the embryonic cortex at E.14.5 show replicating cells that incorporated bromodeoxyuridine (BrdU) during S phase of the cell cycle are shown. c Quantification of BrdU-positive cell density (two-sided Student’s unpaired t test, P = 0.323; n = 38 sections from n = 6 animals per wild-type (+/+) mice, n = 29 sections from n = 4 animals per Abhd4-knockout (−/−) mice). d, e Confocal images and f quantification of PAX6-positive radial glia progenitor cells in the ventricular zone. (two-sided Student’s unpaired t test, P = 0.2598; n = 10 sections from n = 4 animals per wild-type (+/+) mice, n = 10 sections from n = 4 animals per Abhd4-knockout (−/−) mice). g, h Identical pattern of phalloidin-labeling of the adherens junction belt in the ventricular zone (VZ) of wild-type (+/+) and Abhd4-knockout (−/−) mice at E15.5. i, j Low-power confocal images show similar organization of nestin-positive radial processes in both genotypes at E15.5. k, l Correlated confocal and STORM super-resolution microscopy images from both genotypes. m, n STORM super-resolution images reveal that the nanoarchitecture of nestin intermediate filament bundles at the core of the radial glia processes remains intact in the absence of ABHD4. o Density of localization points (LPs) representing nestin (two-sided Student’s unpaired t test, P = 0.297; n = 39 segments from n = 3 animals per wild-type (+/+) mice, n = 57 segments from n = 3 animals per Abhd4-knockout (−/−) mice). p Quantification of full-width-at-half-maximum of nestin filament bundles (two-sided Mann–Whitney U test, P = 0.684; n = 28 segments from n = 3 animals per wild-type (+/+) mice, n = 37 segments from n = 3 animals per Abhd4-knockout (−/−) mice). Graphs show box-and-whisker plots (including minima, maxima and mean values with 2 × standard error, except p where median and lower, upper quartiles are presented) with single values. Scale bars: a–e, i–j: 50 μm, g–h: 20 μm, m, n: 200 μm. Source data are provided as a Source Data file.

