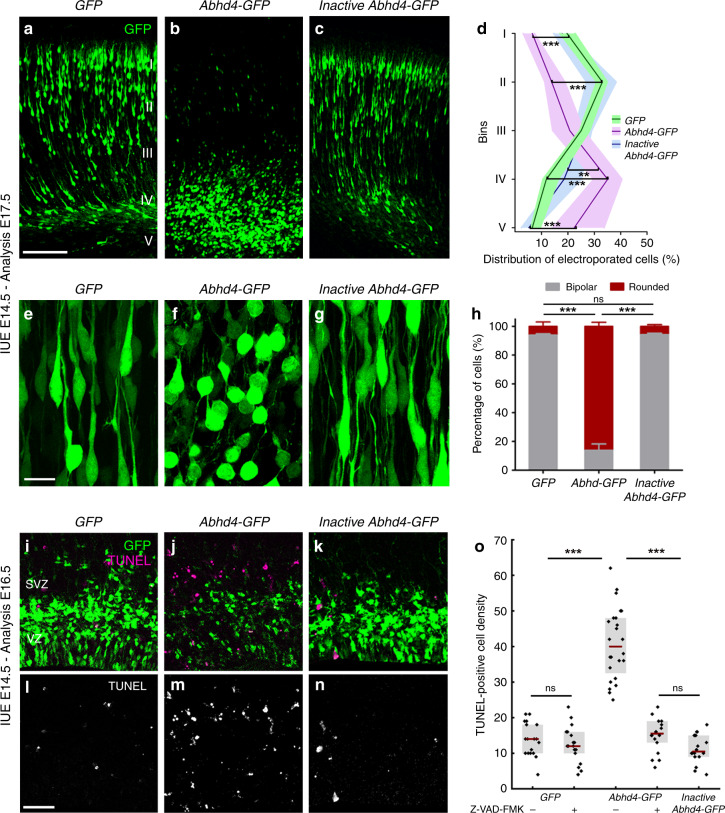
Fig. 5. ABHD4 is sufficient to trigger migration arrest and apoptosis.
Cells in utero electroporated with GFP- (a), or with an Abhd4-GFP-construct encoding an enzymatically inactive form of ABHD4 (c) migrate into the cortical plate, whereas Abhd4-GFP-electroporation causes radial migration defect (b). d Laminar distribution of electroporated cells in five equally-sized bins (Roman numerals) (Kruskal–Wallis test with post hoc Dunn’s test, 1st, 2nd, 4th, 5th bins for all comparisons: ***P < 0.0001, except 4th bin (Inactive Abhd4-GFP vs Abhd4-GFP): **P = 0.006; n = 19 sections from n = 4 animals per GFP-electroporation; n = 18 sections from n = 4 animals per Abhd4-GFP-electroporation; n = 12 sections from n = 3 animals per Inactive Abhd4-GFP-electroporation). Data are shown as median (line) and interquartile range (transparent band in the same color). High-power images show bipolar migrating neurons (e, g), that become rounded upon Abhd4-GFP-electroporation (f). h Quantification of cell morphology (Kruskal–Wallis test with post hoc Dunn’s test, ***P < 0.0001; ns = not significant, P ≈ 1; n = 15–15 sections from n = 3–3 animals per treatment). Graphs show bar plots with median ± interquartile range. i–n Representative images show large density of TUNEL-positive cells upon Abhd4-GFP electroporation in the subventricular (SVZ) and ventricular (VZ) zone (j, m), that is not replicated by GFP- (i, l), or by inactive Abhd4-GFP-electroporation (k, n). o Quantification of TUNEL-positive cell density (Kruskal–Wallis test with post hoc Dunn’s test, ***P < 0.0001; ns = not significant, P ≈ 1 except per Abhd4-GFP-electroporation with Z-VAD-FMK treatment vs Inactive Abhd4-GFP P = 0.607; n = 18–18 sections from n = 3–3 animals per GFP-electroporation with and without Z-VAD-FMK treatment and per Inactive Abhd4-GFP-electroporation; n = 24 sections from n = 4 animals per Abhd4-GFP-electroporation; n = 18 sections from n = 4 animals per Abhd4-GFP-electroporation with Z-VAD-FMK treatment). Graphs show box-and-whisker plots (including minima, maxima, and median values, lower and upper quartiles) with single values. Scale bars: a–c: 100 μm, e–g: 20 μm, i n: 50 μm. Source data are provided as a Source Data file.

