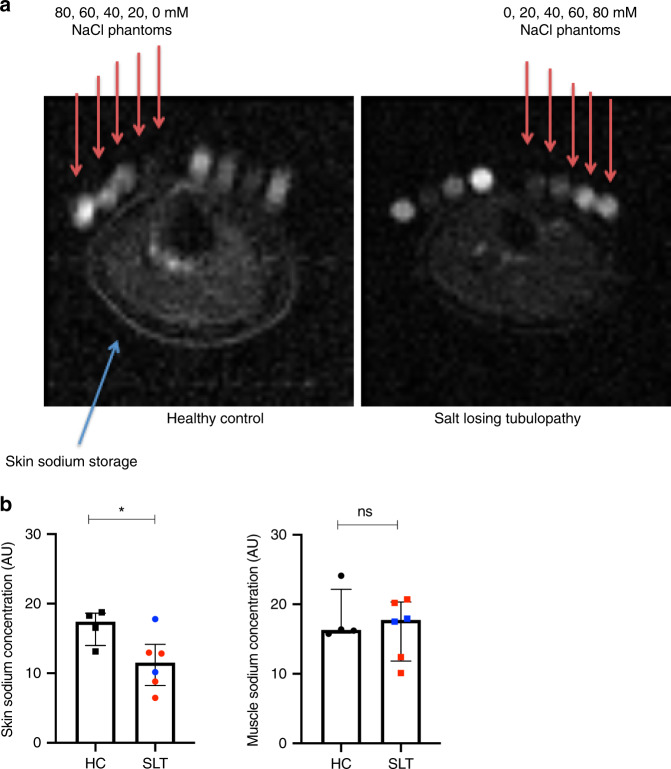
Fig. 1. 23Na MRI demonstrating reduced skin sodium stores in salt-losing tubulopathy patients compared to age-matched healthy controls.
a Representative 23Na MRI images of the lower limb from a SLT patient (Gitelman syndrome) and a HC. Phantoms of known sodium concentration (0–80 mM) are imaged alongside the lower limb (red arrows). b Skin and muscle sodium concentrations as determined by 23Na MRI in SLT patients (GS = 4, red dots; BS type 1 = 2, blue dots) and age-matched healthy controls (n = 4). Skin sodium: HC 17.4 (14.0–18.6) AU, SLT 11.5 (8.2–14.1) AU, p = 0.038; muscle sodium: HC 16.3 (15.9–22.1) AU, SLT 17.7 (11.8–20.3) AU, p = 0.99. Groups are compared with a two-sided Mann–Whitney test. Error bars represent interquartile range around the median. ns not significant (p > 0.05), *p ≤ 0.05, **p ≤ 0.01, ***p ≤ 0.001, ****p ≤ 0.0001. HC healthy control, SLT salt-losing tubulopathy. Source data are provided as a Source data file.

