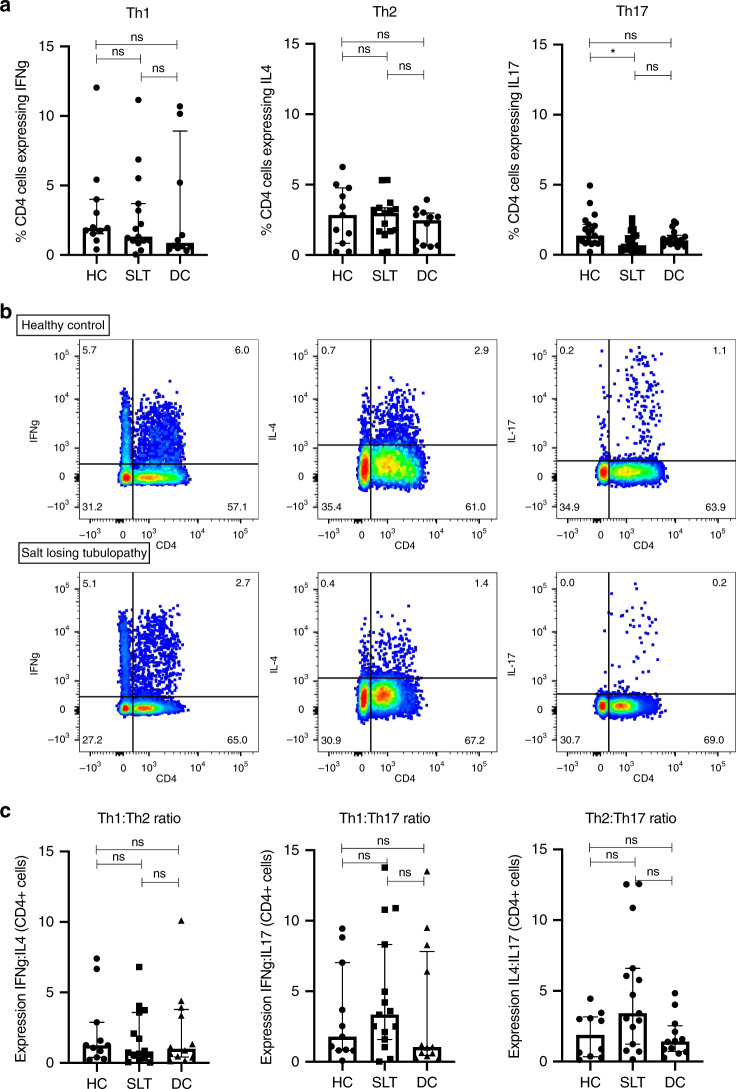
Fig. 3. CD4 subset analysis in salt-losing tubulopathy patients and controls.
a IFNγ, IL-4, and IL-17 expression in CD4+ cells after 4 h stimulation with phorbol myristate acetate and ionomycin in SLT patients (n = 15), healthy controls (n = 11), and disease controls (n = 12). Cytokine expression is reported as percentage of CD4+ cells. Groups are compared with a Kruskal–Wallis test with Dunn’s multiple comparison testing (shown with significance bars). Error bars represent interquartile range around the median. IFNγ expression: HC 1.9% (1.5–4.0), SLT 1.3% (1.0–3.7), DC 0.9% (0.5–8.9), p = 0.53. IL-4 expression: HC 2.8% (0.8–4.8), SLT 3.0% (1.7–3.3), DC 2.5% (0.7–3.0), p = 0.52. IL-17 expression: HC 1.4% (0.9–2.2), SLT 0.7% (0.3–1.4), DC 1.0% (0.8–1.4), p = 0.038. b Representative FACS dot plots of IFNγ, IL-4, and IL-17 expression in CD4+ cells in a SLT patient and HC. Cell proportions as percentages are documented within each quadrant. c Ratio of IFNγ, IL-4, and IL-17 expression in each subject in SLT patients (n = 15), HC (n = 11), and DC (n = 12). Groups are compared with a Kruskal–Wallis test with Dunn’s multiple comparison testing (shown with significance bars). Error bars represent interquartile range around the median. IFNγ:IL-4 (Th1:Th2): HC 1.2 (0.4–2.9), SLT 0.7 (0.3–3.9), DC (1.0 (0.4–3.9), p = 0.82). IFNγ:IL-17 (Th1:Th17): HC 1.8 (0.8–7.0), SLT 3.3 (1.6–8.3), DC 1.0 (0.5–7.8), p = 0.40. IL-4:IL-17 (Th2:Th17): HC 1.9 (0.4–3.2), SLT 3.4 (1.2–6.6), DC 1.4 (0.7–2.5), p = 0.05. ns not significant (p > 0.05), *p ≤ 0.05, **p ≤ 0.01, ***p ≤ 0.001, ****p ≤ 0.0001, HC healthy control, SLT salt-losing tubulopathy, DC disease control. Source data are provided as a Source data file.

