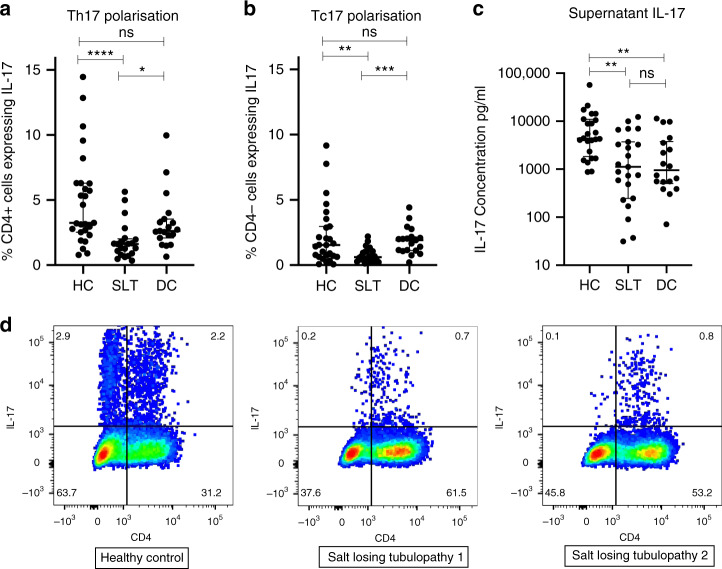
Fig. 4. IL-17 responses in salt-losing tubulopathy patients and controls.
a IL-17 expression in CD4+ cells (Th17) after 1-week culture of HC (n = 27), SLT (n = 21), and DC (n = 19) PBMCs stimulated with anti-CD3, anti-CD28, IL-1, IL-6, IL-21, IL23, and TGFβ: HC 3.2% (2.5–6.3), SLT 1.6% (0.8–2.0), DC 2.6% (2.1–3.5), p = 0.0001. Groups are compared with a Kruskal–Wallis test with Dunn’s multiple comparison testing (shown with significance bars). Error bars represent interquartile range around the median. b IL-17 expression in CD4− cells (Tc17) after 1-week culture of HC (n = 27), SLT (n = 25), and DC (n = 19) PBMCs stimulated with anti-CD3, anti-CD28, IL-1, IL-6, IL-21, IL23, and TGFβ: HC 1.5% (0.6–3.0), SLT 0.6% (0.3–1.1), DC 1.9% (1.1–2.2), p = 0.0005. Groups are compared with a Kruskal–Wallis test with Dunn’s multiple comparison testing (shown with significance bars). Error bars represent interquartile range around the median. c Supernatant IL-17 concentrations cells after 1-week culture of HC (n = 24), SLT (n = 23), and DC (n = 18) PBMCs stimulated with anti-CD3, anti-CD28, IL-1, IL-6, IL-21, IL23, and TGFβ: HC 4287 pg/ml (1681–10,487), SLT 1117 pg/ml (249–3709), DC 951 pg/ml (503–3768), p = 0.0012. Groups are compared with a Kruskal–Wallis test with Dunn’s multiple comparison testing (shown with significance bars). Error bars represent interquartile range around the median. d Representative FACS dot plots of IL-17 expression in CD4+ cells in a HC and 2 SLT patients. Cell proportions as percentages are documented within each quadrant. ns not significant (p > 0.05), *p ≤ 0.05, **p ≤ 0.01, ***p ≤ 0.001, ****p ≤ 0.0001. SLT salt-losing tubulopathy, HC healthy control, DC disease control, PBMCs peripheral blood mononuclear cells. Source data are provided as a Source data file.

