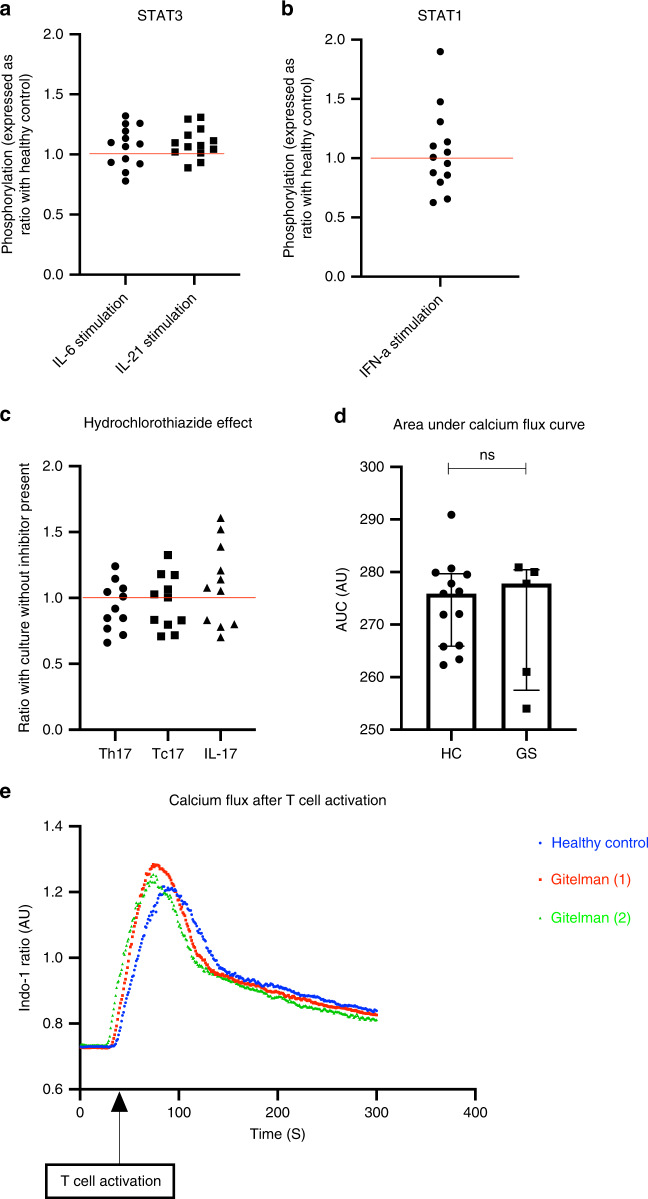
Fig. 5. Initial investigation of impaired IL-17 responses in salt-losing tubulopathy patients.
a Phosphorylation of STAT3 in CD4+ cells after stimulation with IL-6 and IL-21 in SLT patients (n = 13). Phosphorylation is expressed as ratio of upregulation of pSTAT3 in SLT compared to the HC assessed in the same experiment (n = 4 HCs assessed across 4 experiments). Red line drawn at ratio of 1 representing no difference between SLT and HC. b Phosphorylation of STAT1 in CD4+ cells after stimulation with IFNα in SLT patients (n = 13). Phosphorylation is expressed as ratio of upregulation of pSTAT1 in SLT compared to the HC assessed in the same experiment (n = 4 HCs assessed across 4 experiments). Red line drawn at a ratio of 1 representing no difference between SLT and HC. c Th17 and Tc17 polarisation, and supernatant IL-17 concentration in cell culture experiments (11 experiments in 11 healthy controls) with the addition of hydrochlorothiazide (HCT) 20 μM to culture conditions. Each variable is expressed as a ratio to the readout in standard culture conditions; red line drawn at ratio of 1 representing no difference in readouts with the addition of HCT. d Area under the calcium flux curve in healthy controls (n = 13) and Gitelman syndrome patients (n = 5) (as determined using the ratiometric calcium dye Indo-1 gated on CD4+ cells) after T-cell activation with anti-CD3: HC 275.9 AU (265.9–279.9); and Gitelman Syndrome (GS) 277.8 AU (257.5–280.5), p = 0.94. Compared with a two-sided Mann–Whitney test. Error bars represent interquartile range around the median. e Representative calcium flux curves in CD4+ cells after T-cell activation in a healthy control and two patients with GS. ns not significant (p > 0.05), *p ≤ 0.05, **p ≤ 0.01, ***p ≤ 0.001, ****p ≤ 0.0001, SLT salt-losing tubulopathy, HC healthy control, DC disease control, GS Gitelman syndrome. Source data are provided as a Source data file.

