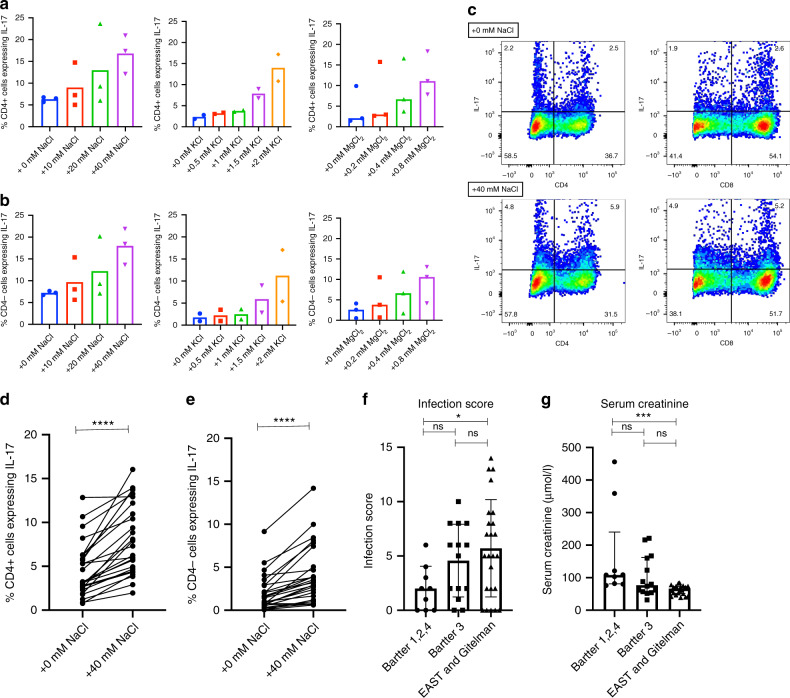
Fig. 7. Effect of altered extracellular ion concentration on Th17 and Tc17 polarisation.
a Effect of NaCl (0–40 mM; n = 1 healthy control), KCl (0–2 mM; n = 2 healthy controls), and MgCl2 (0–0.8 mM; n = 3 healthy controls) on Th17 polarisation after PBMC activation under optimal Th17 polarising conditions. Mean of technical triplicates is plotted for NaCl effect. In other graphs the median for controls is plotted and data points represent mean of technical replicates in each participant. b Effect of NaCl (0–40 mM; n = 1 healthy control), KCl (0–2 mM; n = 2 healthy controls), and MgCl2 (0–0.8 mM; n = 3 healthy controls) on Tc17 polarisation after PBMC activation under optimal Th17 polarising conditions. Mean of technical triplicates is plotted for NaCl effect. In other graphs the median for controls is plotted and data points represent mean of technical replicates in each participant. c Representative FACS dot plots of IL-17 expression in CD4+ (Th17) and CD8+ (Tc17) healthy control cells after activation in normal media and in media supplemented with 40 mM NaCl. Cell proportions as percentages are documented within each quadrant. d. Th17 polarisation of healthy control (n = 26) cells cultured in normal media and in media supplemented with 40 mM NaCl. Th17 cells (as a percentage of CD4+ cells): normal media 3.2% (2.5–6.3); media +40 mM NaCl 7.6% (4.6–12.4); p < 0.0001. Conditions are compared with a two-sided Wilcoxon test. Data points and connecting lines represent change in polarisation within each healthy control. e Tc17 polarisation of healthy control (n = 26) cells cultured in normal media and in media supplemented with 40 mM NaCl. Tc17 cells (as a percentage of CD4− cells): normal media 1.5% (0.6–2.9); media +40 mM NaCl 3.3% (1.5–5.6); p < 0.0001. Conditions are compared with a two-sided Wilcoxon test. Data points and connecting lines represent change in polarisation within each healthy control. f IL-17-related infection score according to SLT biochemical phenotype: BS types 1, 2, and 4 [n = 9] = 2.0 ± 2.1 points; BS type 3 [n = 14] = 4.6 ± 3.3 points; GS and EAST [n = 24] = 5.7 ± 4.5 points; p = 0.05. Groups are compared using a one-way analysis of variance with multiple comparison testing (shown with significance bars). Error bars represent standard deviation around the mean. g Serum creatinine according to SLT biochemical phenotype: BS types 1, 2, and 4 [n = 9] = 108 μmol/l (81–240), BS type 3 [n = 14] = 77 μmol/l (56–162), GS and EAST [n = 24] = 66.5 μmol/l (52–73); p = 0.0005. Groups are compared with a Kruskal–Wallis test and multiple comparison testing (shown with significance bars). Error bars represent interquartile range around the median. ns not significant (p > 0.05), *p ≤ 0.05, **p ≤ 0.01, ***p ≤ 0.001, ****p ≤ 0.0001. Source data are provided as a Source data file.

