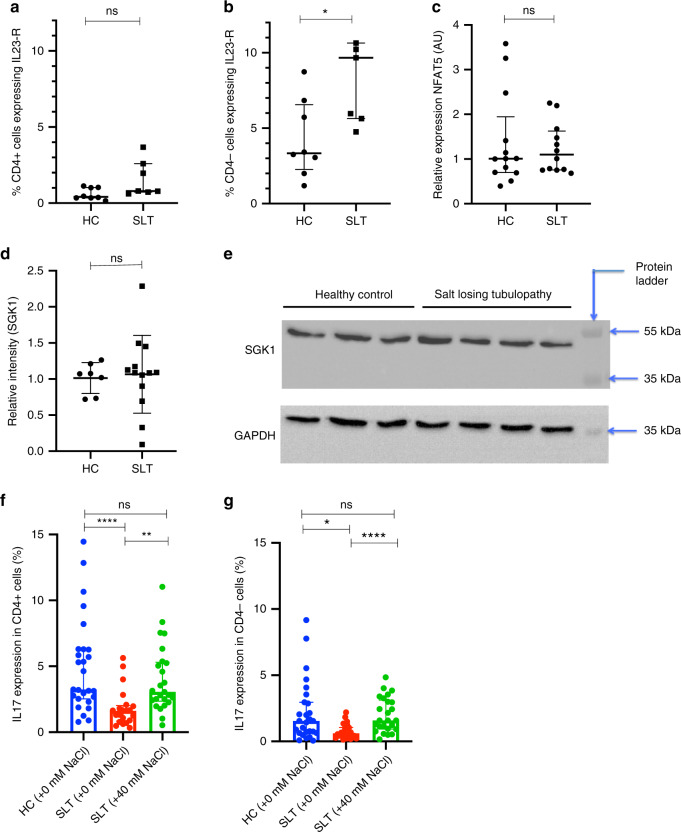
Fig. 8. Expression of the components of the intracellular pathway that mediate salt-driven IL-17 inflammation and salt rescue of in vitro IL-17 responses in salt-losing tubulopathy patients.
a IL-23 receptor expression on unstimulated CD4+ cells in healthy controls (n = 8) and SLT patients (n = 7): HC 0.42% (0.34–1.01), SLT 0.79% (0.73–2.60), p = 0.07. Groups are compared with a two-sided Mann–Whitney test. Error bars represent interquartile range around the median. b IL-23 receptor expression on unstimulated CD4− cells in healthy controls (n = 8) and SLT patients (n = 7): HC 3.34% (2.26–6.56), SLT 9.67% (5.64–10.65), p = 0.02. Groups are compared with a two-sided Mann–Whitney test. Error bars represent interquartile range around the median. c Relative lymphocyte NFAT5 expression in healthy controls (n = 13) and SLT patients (n = 11): HC 1.01 AU (0.70–1.95), SLT 1.10 AU (0.76–1.62), p = 0.85. Groups are compared with a two-sided Mann–Whitney test. Error bars represent interquartile range around the median. d Relative lymphocyte SGK1 expression in healthy controls (n = 7) and SLT patients (n = 13): relative intensity HC = 1.07 AU (0.73–1.2), SLT = 1.09 AU (0.80–1.31), p = 0.70. Groups are compared with a two-sided Mann–Whitney test. Error bars represent interquartile range around the median. e Representative western blot of SGK1 expression in HCs and SLT patients. SGK1 expression was determined in SLT patients (n = 13) and healthy controls (n = 7) across three experiments. f Th17 polarisation in HC (n = 27) and SLT patients (n = 25) in standard media, and in SLT patients in media supplemented with 40 mM NaCl: HC + 0 mM NaCl 3.2% (2.5–6.3); SLT + 0 mM NaCl 1.6% (0.8–2.0); SLT + 40 mM NaCl 3.1% (2.4–5.3); p = <0.0001. Groups are compared using a Kruskal–Wallis test with Dunn’s multiple comparison testing (shown with significance bars). Error bars represent interquartile range around the median. g Tc17 polarisation in HC (n = 27) and SLT patients (n = 25) in standard media, and in SLT patients in media supplemented with 40 mM NaCl: HC + 0 mM NaCl 1.5% (0.6–3.0); SLT + 0 mM NaCl 0.6% (0.3–1.1); SLT + 40 mM NaCl 1.6% (0.9–3.1); p = 0.0007; groups are compared using a Kruskal–Wallis test with Dunn’s multiple comparison testing (shown with significance bars). Error bars represent interquartile range around the median. ns not significant (p > 0.05), *p ≤ 0.05, **p ≤ 0.01, ***p ≤ 0.001, ****p ≤ 0.0001. HC healthy control, SLT salt-losing tubulopathy, AU arbitrary units. Source data are provided as a Source data file.

