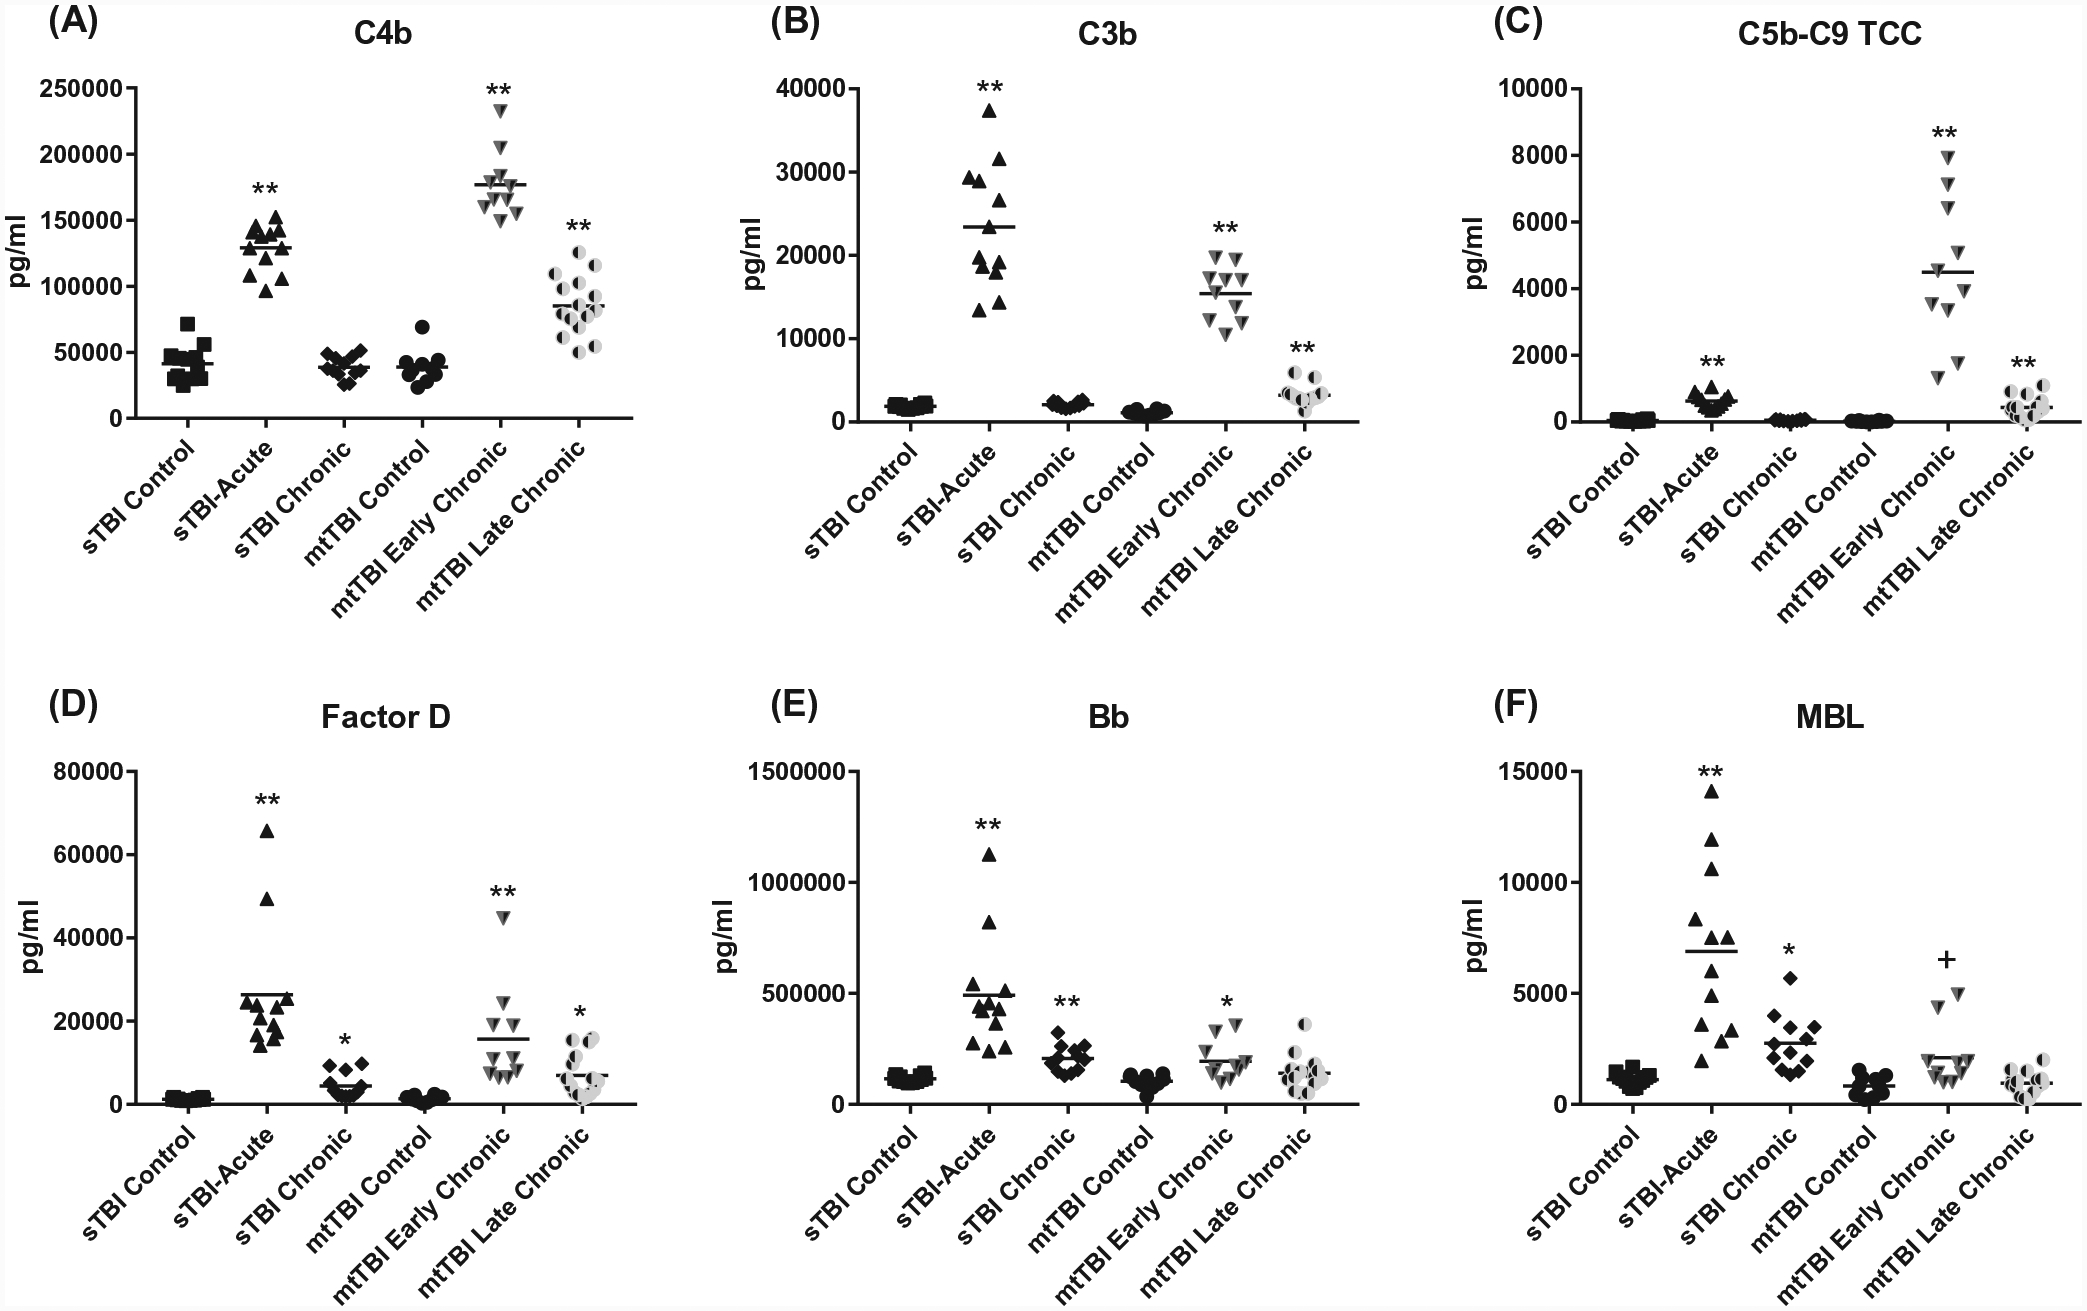
FIGURE 1.

ADE levels of complement effector proteins in sTBI and mtTBI subject groups. Each point represents the value for a control or TBI participant and the horizontal line in point clusters is the mean level for that group. Mean ± SEM for sTBI control, sTBI acute, sTBI chronic, mtTBI control, mtTBI early chronic, and mtTBI late chronic participant values, respectively, are 741 ± 79.6, 501 ± 21.6, 887 ± 74.0, 841 ± 54.9, 483 ± 90.6, and 586 ± 45.9 pg/mL for C4b (A), 1889 ± 65.4, 23 414 ± 2139, 2091 ± 101, 1107 ± 90.6, 15 420 ± 1022, and 3207 ± 289 pg/mL for C3b (B), 45.2 ± 7.25, 629 ± 62.2, 53.4 ± 6.46, 24.3 ± 5.29, 4493 ± 690, and 436 ± 80.5 pg/mL for C5b-9 TCC (C), 741 ± 79.6, 501 ± 21.6, 887 ± 74.0, 841 ± 54.9, 483 ± 90.6, and 586 ± 45.9 pg/mL for factor D (D), 115 423 ± 4298, 491 384 ± 73 188, 206 574 ± 17 089, 103 866 ± 9960, 194 506 ± 27 240, and 140 820 ± 20 312 pg/mL for Bb (E), and 1121 ± 82.4, 6899 ± 1112, 2752 ± 363, 829 ± 144, 2109 ± 440, and 955 ± 127 pg/mL for MBL (F). The significance of differences shown between values for controls and TBI subjects were calculated by an unpaired Student’s t test; +P < .05, *P < .01, **P < .0001
