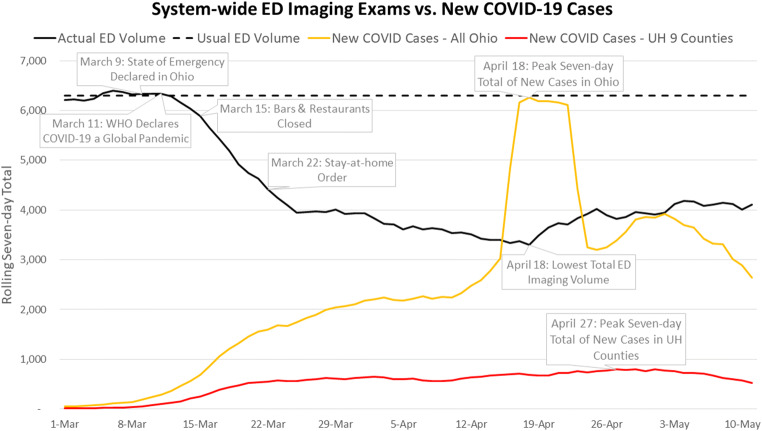
Fig. 1.
The rolling 7-day total number of imaging exams performed in the emergency department setting within the healthcare institution. Indicated on the actual ED volume line are key policy dates. The dashed horizontal line represents the normalized or expected number of total exams performed over a 7-day period between March 1, 2020, and March 9, 2020. The 7-day total number of new COVID-19 cases overall in the state of Ohio and in the nine-county fingerprint is superimposed

