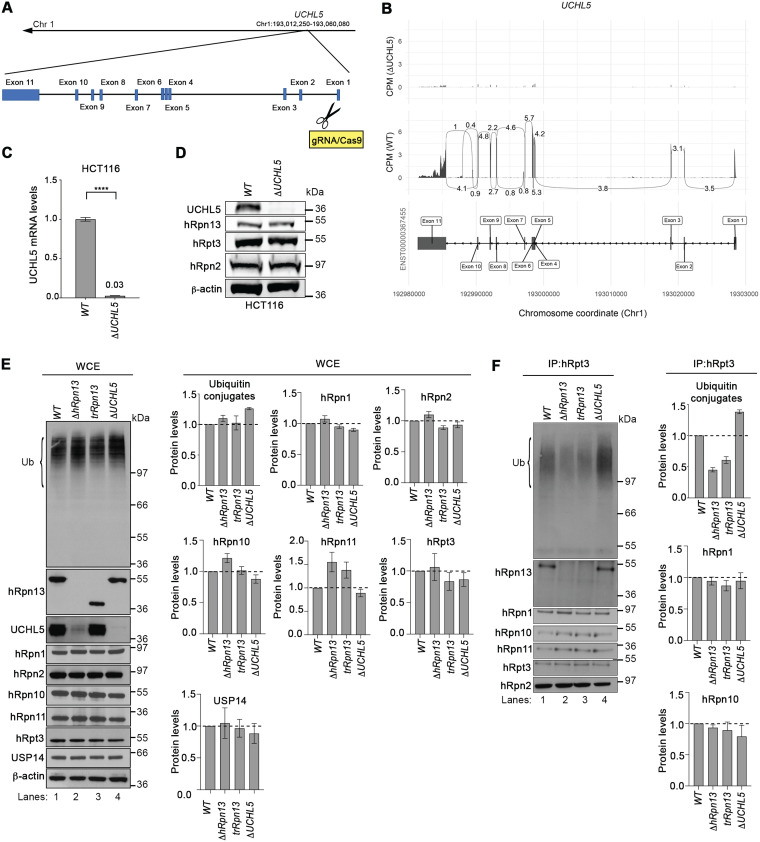
FIG 2.
Levels of ubiquitinated proteins at the proteasome are altered in cells deleted of hRpn13, UCHL5, or the hRpn13 Pru. (A) Schematic representation of the UCHL5 gene from chromosome 1 depicting and labeling the exons as well as the gRNA targeting of exon 1 to generate the ΔUCHL5 cell line. (B) Sashimi plots depicting normalized coverage for the UCHL5 gene in HCT116 ΔUCHL5 or WT cells. (Top) CPM-normalized expression is shown along the y axis for the length of the gene along the x axis. Reads spanning splice junctions are depicted as arcs annotated with CPM-normalized counts. (Bottom) Schematic of the primary transcript (ENST00000367455) for the gene from the Ensembl database, version 75, with exons shown as boxes, introns shown as lines, and arrows indicating the direction of transcription. Numbers at the bottom denote the chromosomal coordinates along chromosome 1. (C) Total RNA from WT or ΔUCHL5 cells was reverse transcribed to cDNA and subjected to TaqMan PCR for UCHL5 mRNA analysis. β-Actin was used as an internal standard, and the data were normalized to the WT by using the 2–ΔΔCT method. Reported values represent means, with error bars indicating standard errors of the means (SEM) for n = 6. Fold change is also indicated for ΔUCHL5 compared to the WT. ****, P < 0.0001 by Student's t test analysis. (D) Lysates from WT or ΔUCHL5 cells were resolved and analyzed by immunoprobing for hRpn13, hRpt3, or hRpn2, as indicated, with β-actin as a loading control. (E) Whole-cell extract (WCE) from WT, ΔhRpn13, trRpn13, or ΔUCHL5 cells were resolved and analyzed by immunoprobing for ubiquitin (Ub), hRpn13, UCHL5, or proteasome components hRpn1, hRpn2, hRpn10, hRpn11, hRpt3, or USP14, as indicated. β-Actin was used as a loading control. Graphical plots show protein levels in ΔhRpn13, trRpn13, or ΔUCHL5 cells relative to the WT after normalization to β-actin for ubiquitin (Ub) levels in the region bracketed (left), hRpn1, hRpn2, hRpn10, hRpn11, hRpt3, and USP14. Data are plotted as average fold changes ± SEM for three independent experiments. (F) Proteasomes from WT, ΔhRpn13, trRpn13, or ΔUCHL5 cells were immunoprecipitated (IP) with anti-Rpt3 antibodies and the immunoprecipitates immunoprobed for ubiquitin (Ub), hRpn13, UCHL5, or proteasome components hRpn1, hRpn2, hRpn10, hRpn11, or hRpt3, as indicated. Graphical plots indicate protein levels in ΔhRpn13, trRpn13, or ΔUCHL5 cells relative to the WT after normalization to hRpn2 for ubiquitin (Ub) levels in the region bracketed (left), hRpn1 and hRpn10. Data are plotted as average fold changes ± SEM for three independent experiments. Bulk ubiquitin was probed with antiubiquitin/P4D1 (3936; Cell Signaling Technology). Dashed lines are included for the plots in panels E and F at a value of 1.0.

