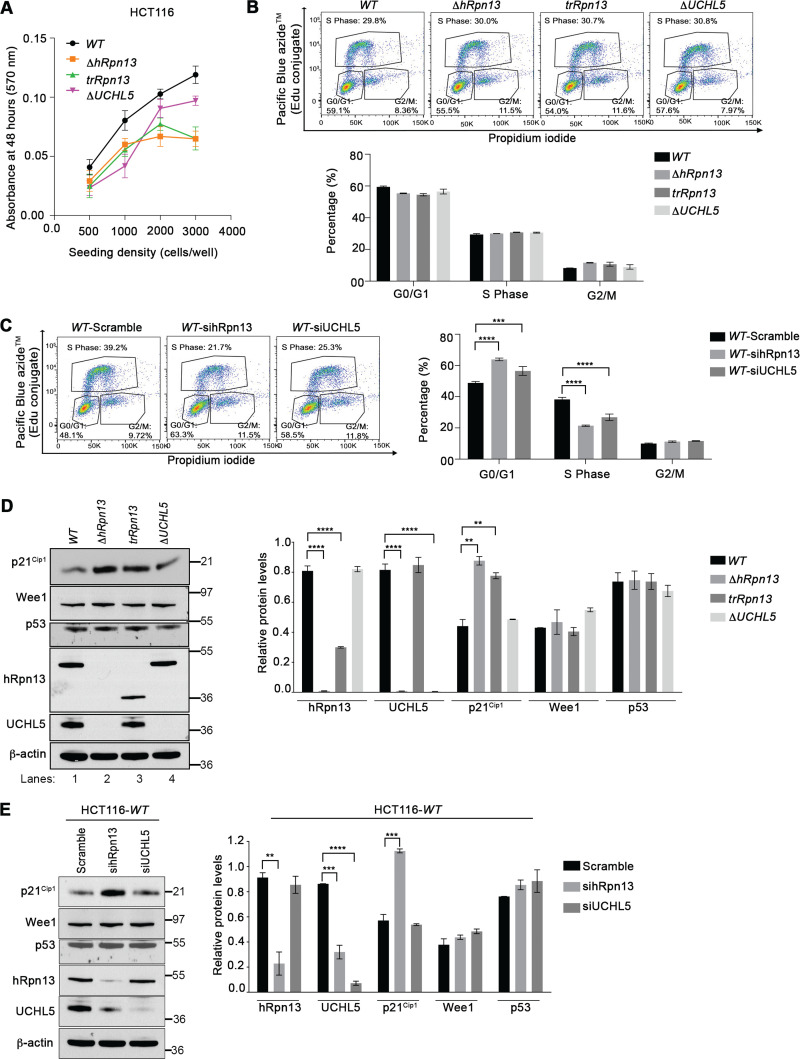
FIG 3.
Transient loss of hRpn13 or UCHL5 disrupts cell cycle progression in HCT116 cells. (A) Metabolic activity of WT, ΔhRpn13, trRpn13, or ΔUCHL5 cells measured by MTT assay at 48 h postseeding for the indicated cell density (n = 6). (B) Representative image (top) and plot (bottom) for flow cytometry analyses of WT, ΔhRpn13, trRpn13, or ΔUCHL5 cells from three independent experiments with triplicate repetitions. The cells were seeded at 0.4 million cells per well in 6-well plates for 48 h and subsequently labeled with EdU and propidium iodide. The distribution of cells in G0/G1, S, and G2/M is shown (bottom) by plotting the mean and SEM (error bar) for each cell line. (C) WT cells treated with scrambled control RNA or siRNA targeting hRpn13 (sihRpn13) or UCHL5 (siUCHL5) for 48 h, followed by labeling with EdU and propidium iodide, were subjected to flow cytometry analyses. A representative image (right) and plot (left) for the distribution of cells in G0/G1, S, and G2/M is provided from three independent experiments with triplicate repetitions. The plot indicates the means and SEM (error bars). ***, P < 0.001; ****, P < 0.0001; two-way ANOVA, Dunnett’s post hoc test. (D, left) Lysates from WT, ΔhRpn13, trRpn13, or ΔUCHL5 cells seeded at 0.4 million cells per well in 6-well plates for 48 h were resolved and immunoprobed for p21Cip1, Wee1, p53, hRpn13, UCHL5, or β-actin (as a loading control) as indicated (representative image). (Right) The quantitation of protein levels normalized to β-actin from three independent experiments is displayed. Averaged values are plotted with error bars indicating SEM. ****, P < 0.0001; analyses were done by Student's t test. (E, left) Lysates from WT cells treated with scrambled control RNA or siRNA targeting hRpn13 (sihRpn13) or UCHL5 (siUCHL5) were resolved and immunoprobed as indicated for p21Cip1, Wee1, p53, hRpn13, UCHL5, or β-actin (as a loading control; shown is a representative image). (Right) Quantitation of protein levels normalized to β-actin across three independent experiments. Averaged values are plotted with error bars indicating SEM (****, P < 0.0001; Student's t test).

