FIG 5.
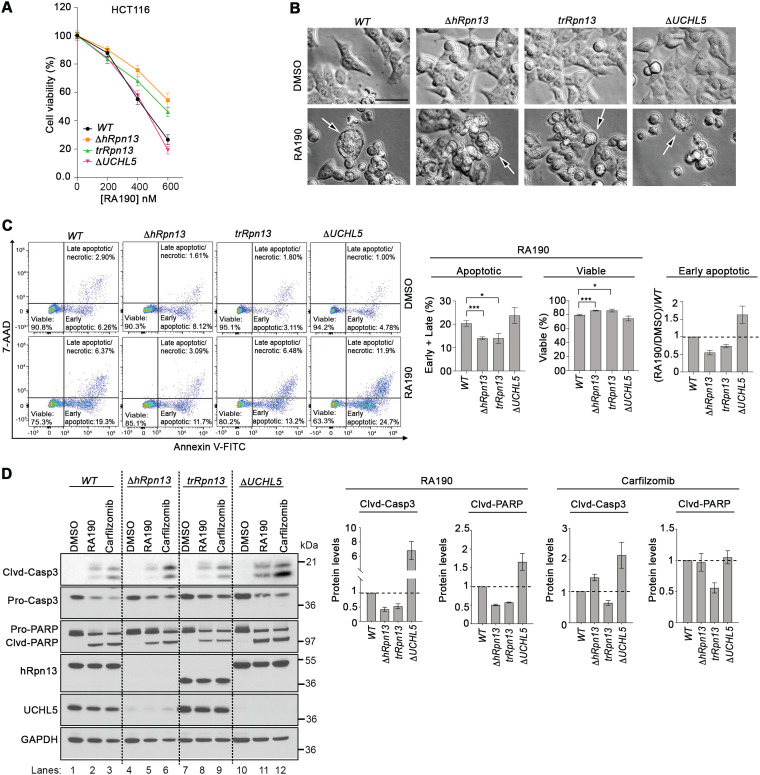
RA190-triggered cell death is reduced in trRpn13 but not UCHL5 cells. (A) Viability of HCT116 (WT), ΔhRpn13, trRpn13, or ΔUCHL5 cells treated for 48 h with the indicated concentration of RA190 or DMSO (as a control), as assessed by MTT assays. (B) WT, ΔhRpn13, trRpn13, or ΔUCHL5 cells were exposed for 24 h to RA190 (1 μM) or DMSO (as a control) and monitored for morphological changes by bright-field microscopy. Arrows indicate blebbing cells undergoing apoptosis. Images shown are representative of two independent experiments (scale bar, 20 μm). (C) WT, ΔhRpn13, trRpn13, or ΔUCHL5 cells treated for 24 h with RA190 (1 μM) or DMSO (as a control) were subjected to flow cytometry analyses after staining with annexin V-FITC and 7-aminoactinomycin D (7-AAD) (representative data are on the left). Population percentage of early and late combined apoptotic or viable cells across three independent experiments is plotted (center) and performed as described for the left. A plot of the ratio of RA190-treated cells to corresponding DMSO control following normalization to the WT is also included for the early apoptotic cell population. The plotted data represent the means and SEM (error bars); *, P < 0.05; ***, P < 0.001; Student's t test. (D) Whole-cell extract from WT, ΔhRpn13, trRpn13, or ΔUCHL5 cells treated for 24 h with RA190 (1 μM), carfilzomib (100 nM), or DMSO (control) was immunoprobed for apoptotic markers caspase 3 (Casp 3) and PARP, hRpn13, UCHL5, or GAPDH (as a loading control; representative image is on the left). Clvd, cleaved. The ratio of cleaved caspase 3 (Clvd-Casp3) to procaspase 3 (Pro-Casp3) or of cleaved PARP (Clvd-PARP) to pro-PARP (Pro-PARP) for RA190- or carfilzomib-treated ΔhRpn13, trRpn13, or ΔUCHL5 cells is plotted normalizing to the respective RA190- or carfilzomib-treated WT cells for three independent experiments, performed as shown on the left. The plotted data represent the means and SEM (error bars). Dashed lines are displayed at a value of 1.0.

