Figure 1.
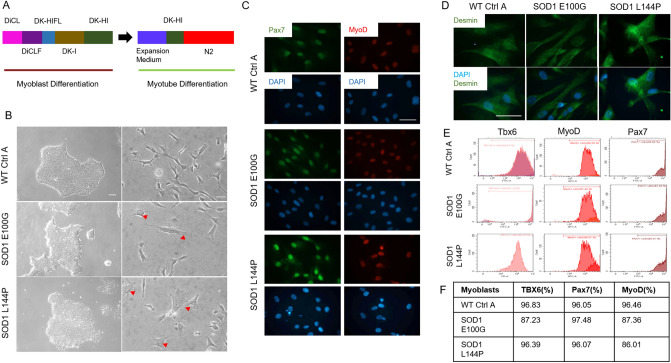
Myoblast derivation and myogenic characterization. (A) Illustration of the differentiation protocol used in both myoblast and myotube phases of differentiation. (B) (left panel) Phase contrast images of iPSC cultures of the various cell lines in maintenance medium (scale bar = 100 μm). (B) (right panel) Phase contrast microscopy images of resultant myoblast cultures after replating in proliferation medium at the end of the myoblast differentiation phase (scale bar = 50 μm). Red arrowheads directed at flat myoblasts in SOD1 cultures. (C) Immunocytochemistry (ICC) staining of derived myoblasts for Pax7 and MyoD expression across all cell lines (scale bar = 50 μm). (D) ICC staining for Desmin expression in WT and SOD1 cultures. (E) Flow cytometry (FC) result plots showing TBX6 expression during the first week of differentiation (left panel) and PAX7 and MyoD expression by the third week of myoblast differentiation (middle and right panels respectively). Data analyzed with CytExpert software, version 2.1 (Beckman Coulter). (F) Tabulated percentage values of FC results.

