Figure 2.
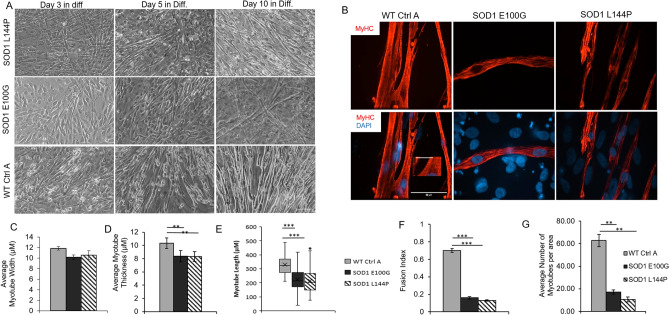
Phenotypic myotube characterization. (A) Phase contrast images showing myotube derivation from myoblasts from the three cell lines. Scale bar = 100 μm. (B) ICC images of myotube cultures stained for MyHC and DAPI. Note the unfused background cells in the DAPI+/MyHC SOD1 cultures. Imaged with Volocity software, version 6.3.0 (PerkinElmer). Scale bar = 50 μm. (C) Bar graph showing slightly decreased myotube cross sectional width compared in SOD1 cultures relative to WT (Error bars CI = 90%). (D) Average myotube thickness **p value = 0.018. (E) Box and Whisker plots describing the lengths of WT and SOD1 myotubes. ***p value < 0.001. One-way ANOVA, followed by Dunnett’s test. (F) Bar graph showing fewer fusion events in the SOD1-mutant cultures compared to WT, evidenced by fusion index. (G) Bar graphs indicating lower average myotube number per area in SOD1 cultures compared to WT. Error bars: SEM *p < 0.1; **p < 0.01; ***p < 0.001 by Student T-test, 2 tails, unequal variance.

