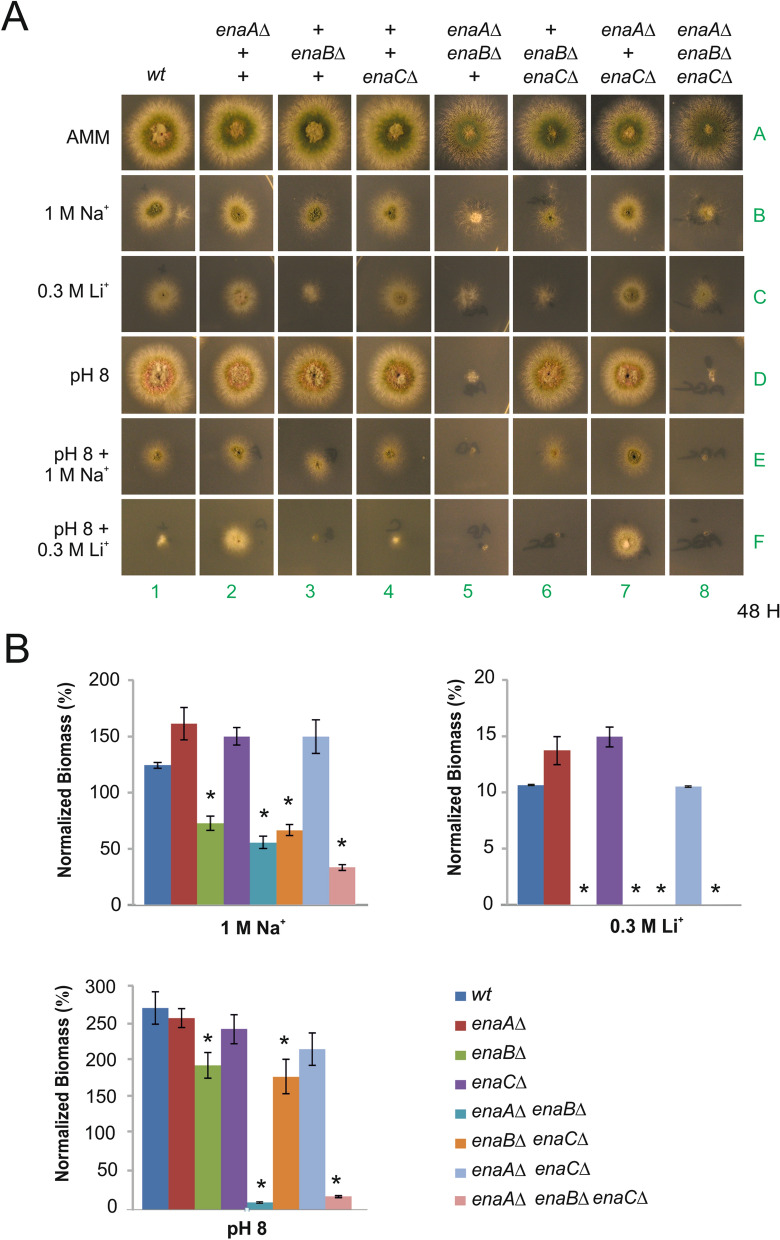
Figure 2.
Functional analysis of null ena mutants. (A) Spores of single-, double- and triple-null strains were point-inoculated and images of colonies were taken after 48 h of incubation at 37 °C in solid AMM (row 1), AMM supplemented with 1 M NaCl (Na+; row 2) or 0.3 M LiCl (Li+; row 3), AMM adjusted to pH 8 with 50 mM Tris–HCl pH8 (alkaline pH; row 4), and AMM that combined the Tris–HCl buffer with either 1 M NaCl (pH 8 + Na+; row 5) or 0.3 M LiCl (pH 8 + Li+; row 6). (B) Biomass production was determined by measuring the dry weight of cells grown in liquid AMM for 24 h at 37 °C with and without elevated concentration of cations (1.0 M NaCl and 0.3 M LiCl) or alkaline pH. Data is presented as percentages and normalized by designating the growth of each strain in standard AMM (no stress agents) as 100%. Graphs show the means of three replicates per strain and condition, and error bars indicate standard deviation. Asterisks indicate a significant variation in biomass production (p < 0.05) as compared to the reference wild-type strain. N = 3.

