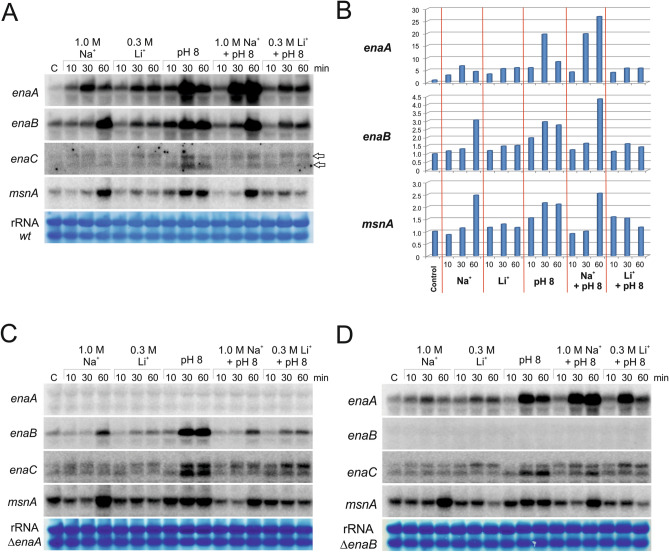
Figure 3.
Expression analysis of ena genes. Northern-blot analyses showing transcript levels of enaA, enaB, enaC and msnA in samples grown in AMM for 18 h (lane C) and subsequently cultivated with 1 M NaCl (Na+), 0.3 M LiCl (Li+), at pH 8 or in AMM that combined pH 8 with either 1.0 M NaCl (pH8 + Na+) or 0.3 M LiCl (pH8 + Li+) for additional 10, 30 or 60 min. (A) and (B) show expression levels in a wild-type strain and their quantification, while (C) and (D) show the results corresponding to null enaA and null enaB backgrounds, respectively. Ribosomal RNA (rRNA) stained with methylene blue was used as a loading control. The graphs in (B) show the ratios between average pixel intensity for each hybridization band and the corresponding loading control band. Average pixel intensity for each band was quantified using Image J software (version 4.0; Fujifilm, Valhalla, NY).

