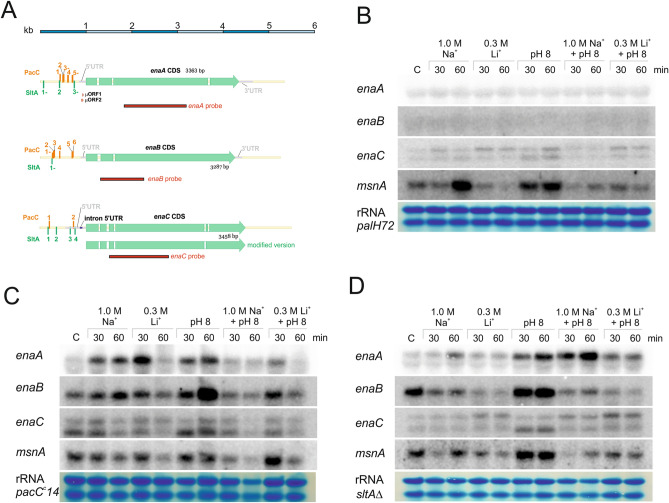
Figure 4.
Transcriptional regulation of ena genes by PacC and SltA. (A) Schematic representation of enaA, enaB and enaC loci based on the information available in the AspGD database and our RNA-seq results. At the top a scale of 6 kb is shown. The last intron of enaC is not processed and adds 13 codons to the coding sequence (see main text). Alternative splicing events are also likely in enaA and mainly enaC (see main text). The promoter regions of ena genes are included, with the number and distribution of PacC and SltA binding sites. The red bars represent the radioactive probes used in Northern-blot experiments. (B) Northern-blot analyses showing transcript levels of enaA, enaB, enaC and msnA in samples collected in the absence, C, and presence, 30 or 60 min, of high cation concentrations (same as in Fig. 3). (B) Corresponds to the palH72 background, (C) to a pacCc14 background and (D) to a null sltA background. Ribosomal RNA (rRNA) stained with methylene blue was used as a loading control.

