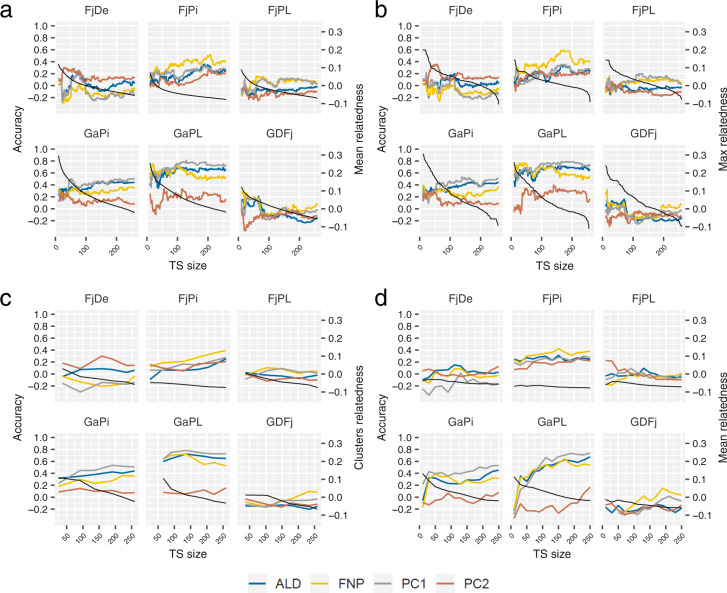
Fig. 5. Optimization of the training population for predictions of four texture sub-traits in each family using a priori information from marker data.
a Addition of genotypes in the TS by decreasing mean relatedness to the predicted family; (b) Addition of genotypes in the TS by decreasing maximum relatedness to the predicted family; (c) Addition of clusters (identified with a k-means algorithm) by decreasing mean relatedness to the predicted family; (d) Selection of genotypes for TS of different sizes based on the five principal components obtained with discriminant analysis of principal components and using the CDmean design criterion. The color legend applies for all parts of the figure. The black curve depicts the value of the relatedness criterion, with the corresponding y-axis on the right-hand side. ALD acoustic linear distance, FNP number of force peaks, PC1 principal component 1 (synthetic trait representing firmness), PC2 principal component 2 (synthetic trait representing crispness)

