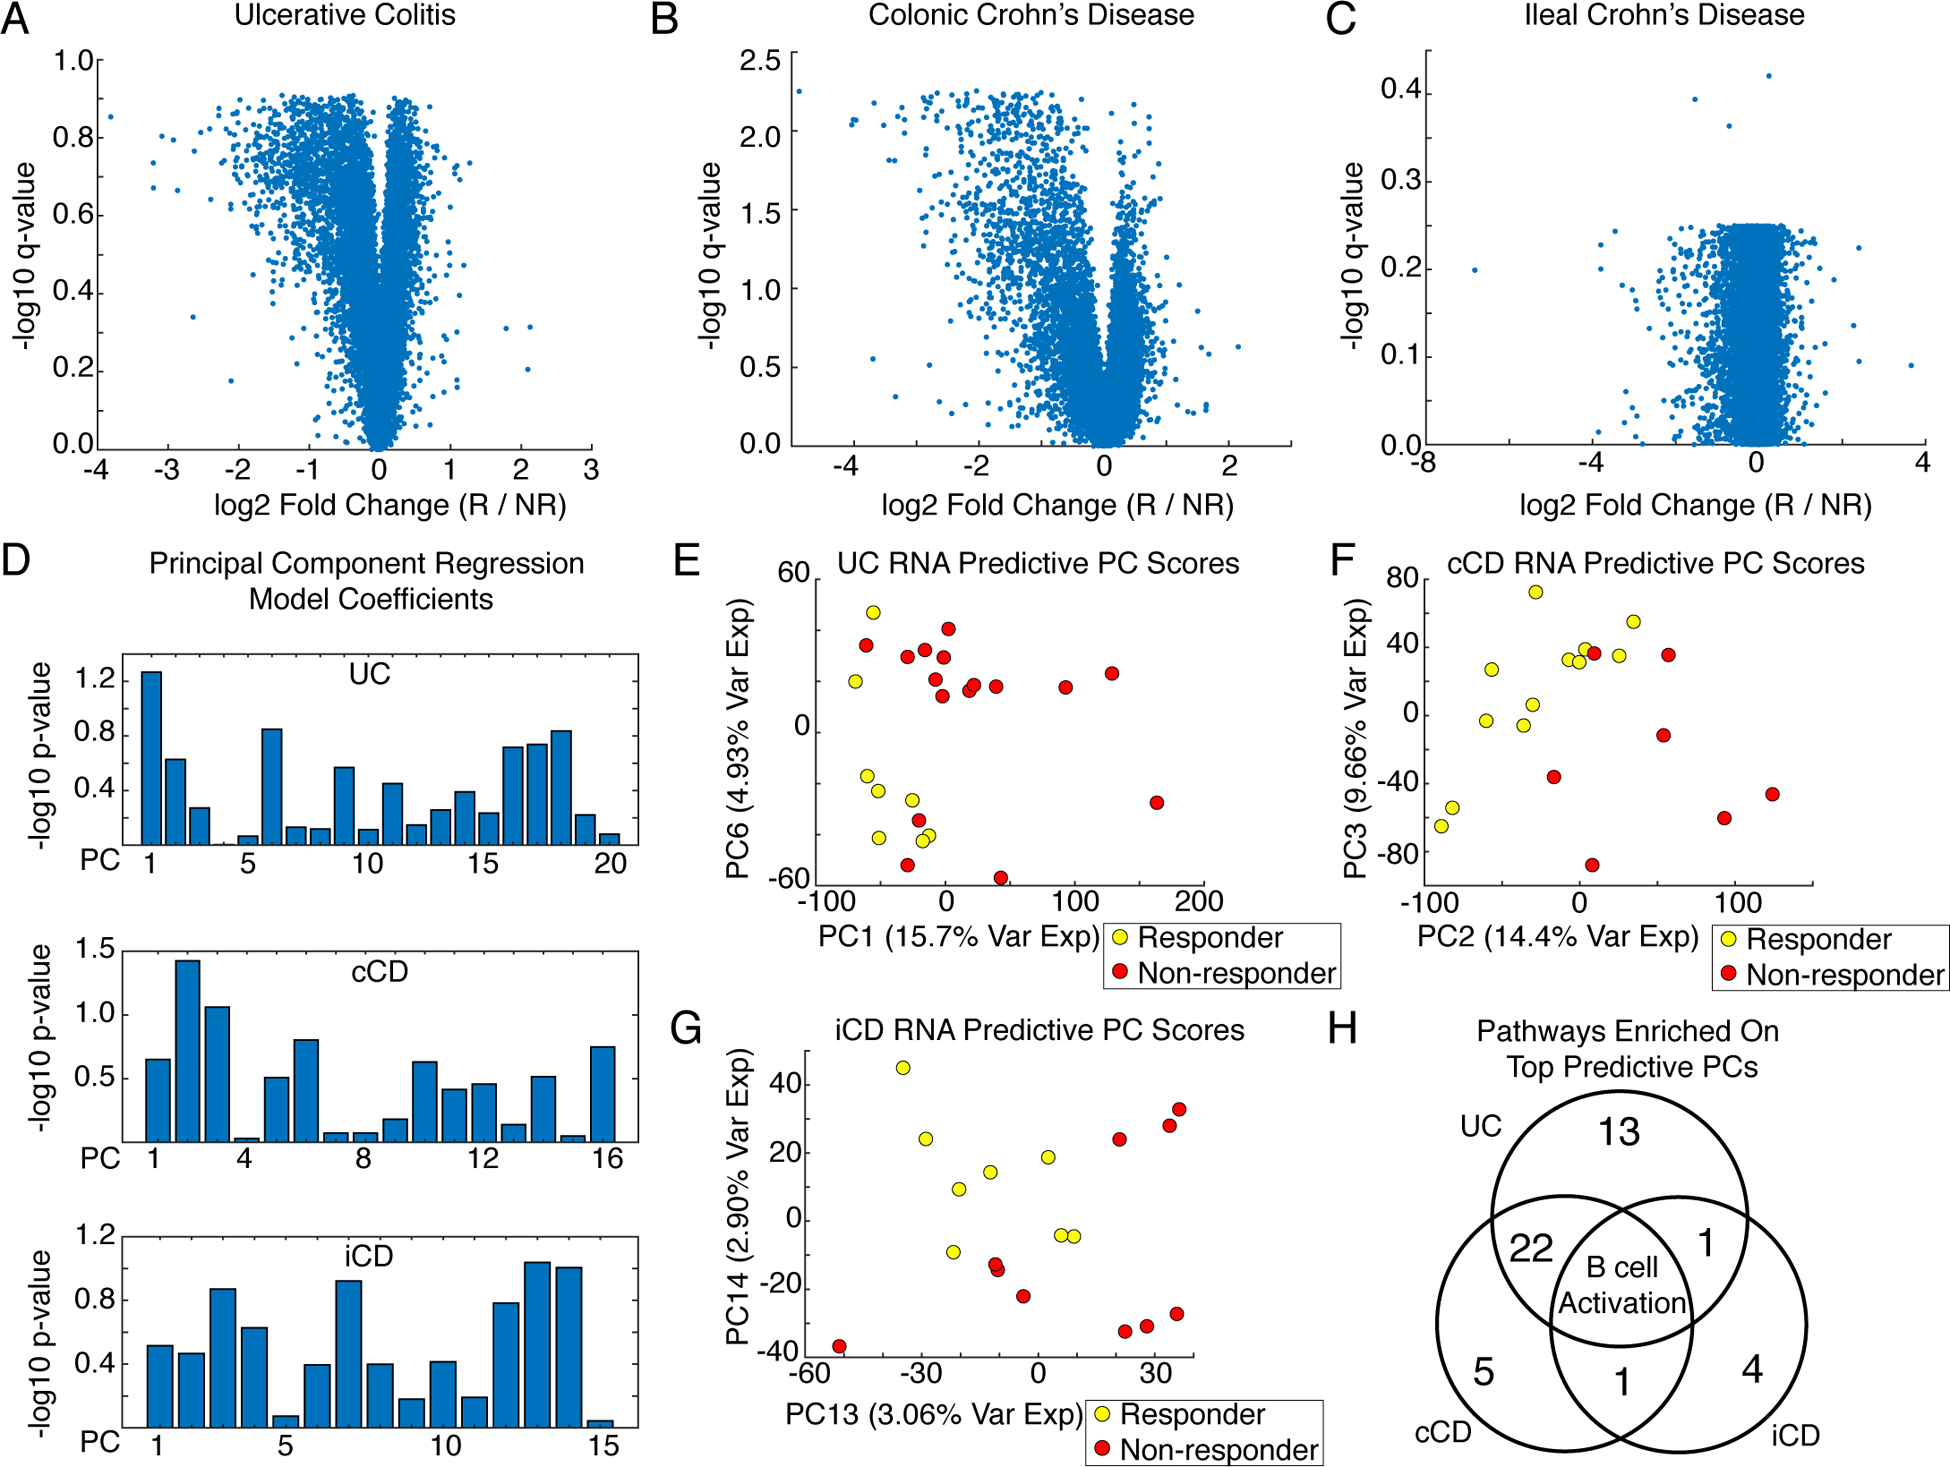
Fig 1. Tissue-specific signatures of infliximab resistance.

(A to C) Volcano plots of differential gene expression analysis (Wilcoxon Mann-Whitney, Benjamini Hochberg False Discovery Rate) from intestinal biopsies from patients with (A) Ulcerative colitis (UC, N = 24 patients), (B) colonic Crohn’s disease (cCD, N = 19 patients), and (C) ileal Crohn’s disease (iCD, N = 18 patients) comparing infliximab responders (R) and nonresponders (NR). Data were jittered for visualization. (D) PC regression coefficients predicting infliximab response from PCs explaining 95% variance in the UC, cCD, and iCD transcriptomic data. (E) Scores plot for the most predictive RNA PCs from the UC biopsies. (F) Scores plot for the most predictive RNA PCs in the cCD biopsies. (G) Scores plot for the most predictive RNA PCs in the iCD biopsies. (H) Comparison of pathways enriched for the top predictive PCs.
