
Fig. 3. TransComp-R of cCD and UC infliximab response against the IBD mouse models.
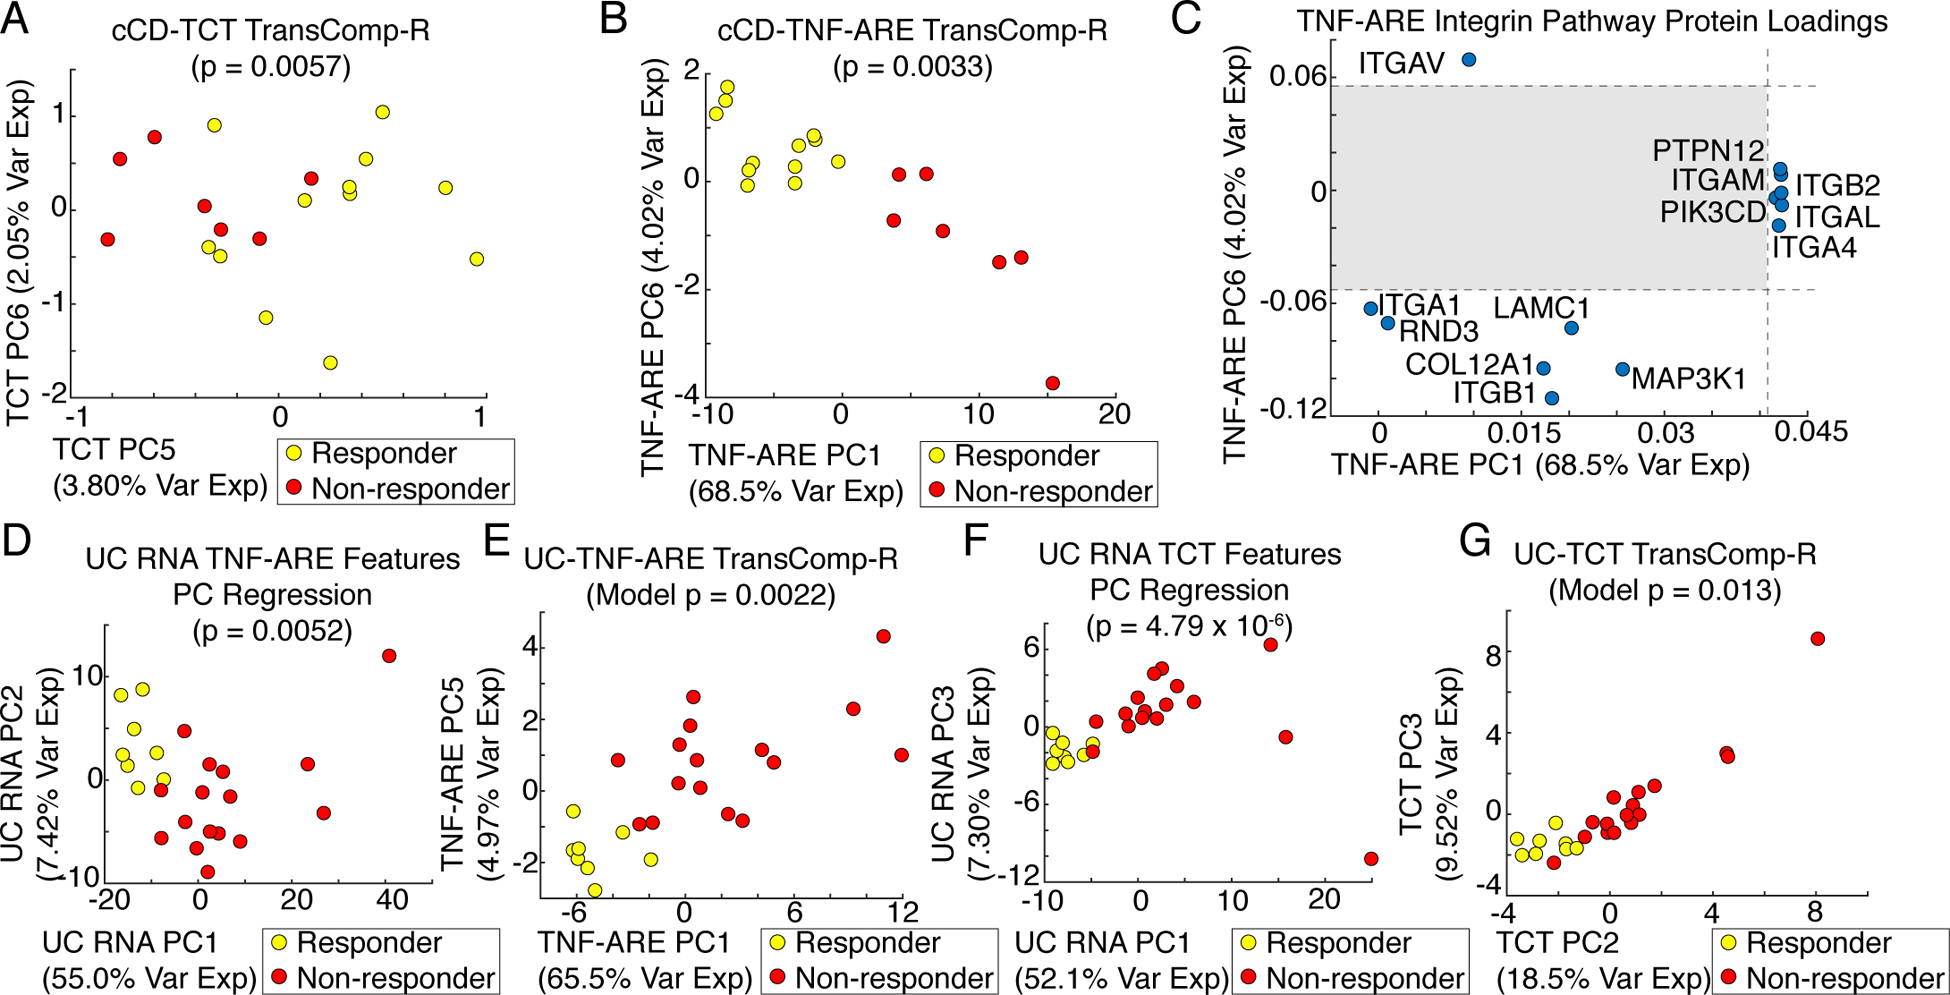
(A) Scores plot of the cCD-TCT mouse TransComp-R model of 335 infliximab resistance–associated, differentially expressed orthologous proteins (N = 19 patients). (B) Scores plot of the cCD-TNF-ARE mouse TransComp-R model of 810 infliximab resistance–associated, differentially expressed orthologous proteins (N = 19 patients). (C) Significant integrin pathway protein loadings on TNF-ARE mouse PC1 and PC6 with the non-significant region shaded (N = 8 mice). (D) Scores plot of the human UC principal component regression model of 368 infliximab resistance–associated, differentially expressed TNF-ARE mouse orthologous genes (N = 24 patients). (E) Scores plot of the UC-TNF-ARE mouse TransComp-R model of 368 infliximab resistance–associated differentially expressed orthologous proteins (N = 24 patients). (F) Scores plot of the human UC principal component regression model of 144 infliximab resistance–associated, differentially expressed TCT mouse orthologous genes (N = 24 patients). (G) Scores plot of the UC-TCT mouse TransComp-R model of 144 infliximab resistance–associated, differentially expressed orthologous proteins (N = 24 patients).