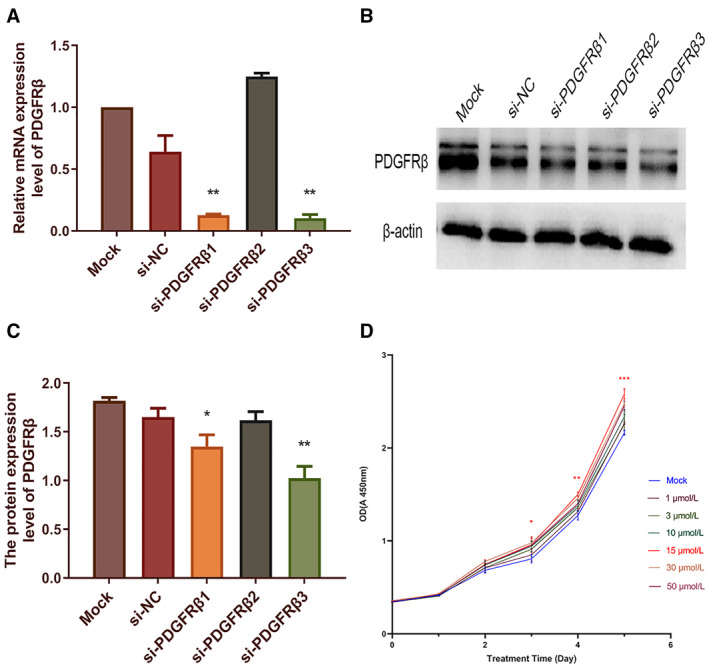
Fig. 1.

Screening of the best inhibition target for PDGFRβ and the best concentration of PDGF‐BB. The HOS cells were separately transfected with three siRNA‐PDGFRβ sequences (1–3) respectively to down‐regulate the expression of PDGFRβ. After transfection for 48 h, the relative expression of PDGFRβ mRNA in HOS cells was examined by qRT‐PCR (A), and GAPDH served as an internal control. After transfection for 72 h, the expression of PDGFRβ on protein level was examined by western blot assay, and protein bands were quantified (B, C). Densitometric analysis of each protein level was calculated from the average of three experiments, and β‐actin was used as an internal control. After PDGF‐BB was stimulated, cell viability of HOS cells was determined by CCK‐8 assay (D). Differences between multiple groups were compared with the one‐way ANOVA, followed by Newman–Keuls posttest. Data represent the mean ± SD of three independent experiments. *P < 0.05, **P < 0.01, ***P < 0.001.
