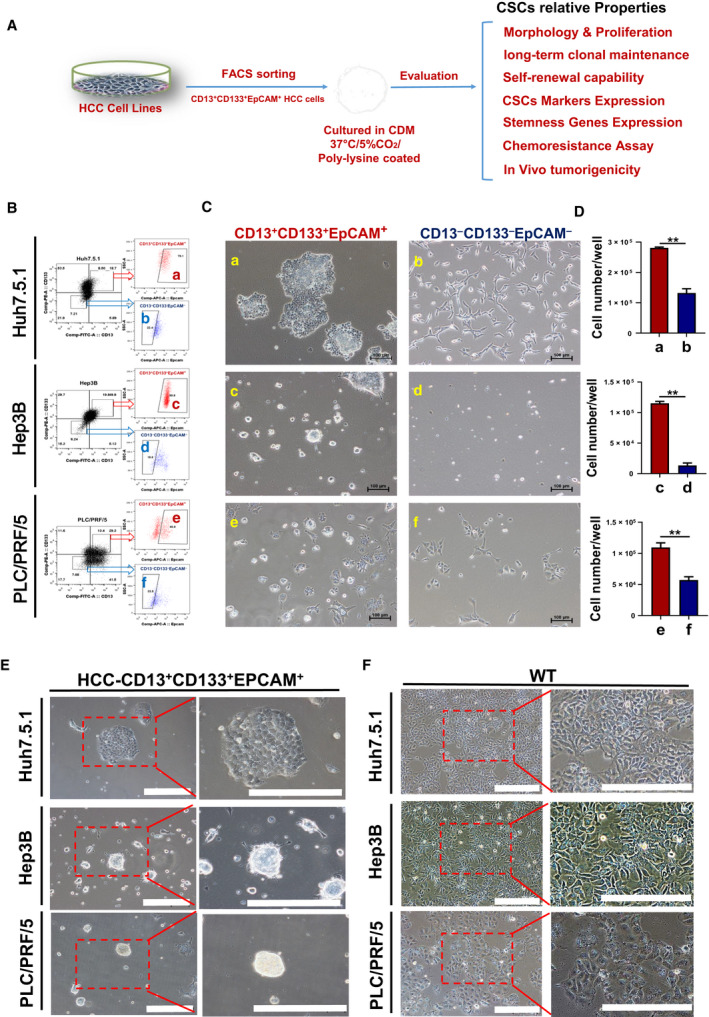
Fig. 1.

Morphology and proliferation of enriched L‐CSCs versus non‐CSCs in CDM. (A) Brief schematic diagram of L‐CSCs enriching, culturing and analysis in this study. (B) The HCC cells sorting by FACS: (a, c, e) CD13+CD133+EpCAM+ HCC cells and (b, d, f) CD13−CD133−EpCAM− HCC cells. (C) Morphology of enriched L‐CSCs versus non‐CSCs cultured by modified CDM for 2 weeks. Scale bars: 100 μm. (D) Statistical histogram for proliferation of the two groups; n = 3, mean ± SEM. *P < 0.05; **P < 0.01, by Student's t‐test. (E, F) Morphology of enriched L‐CSCs cultured by modified CDM for 4 weeks versus that of wild‐type (WT) HCC cells. Scale bars: 200 μm.
