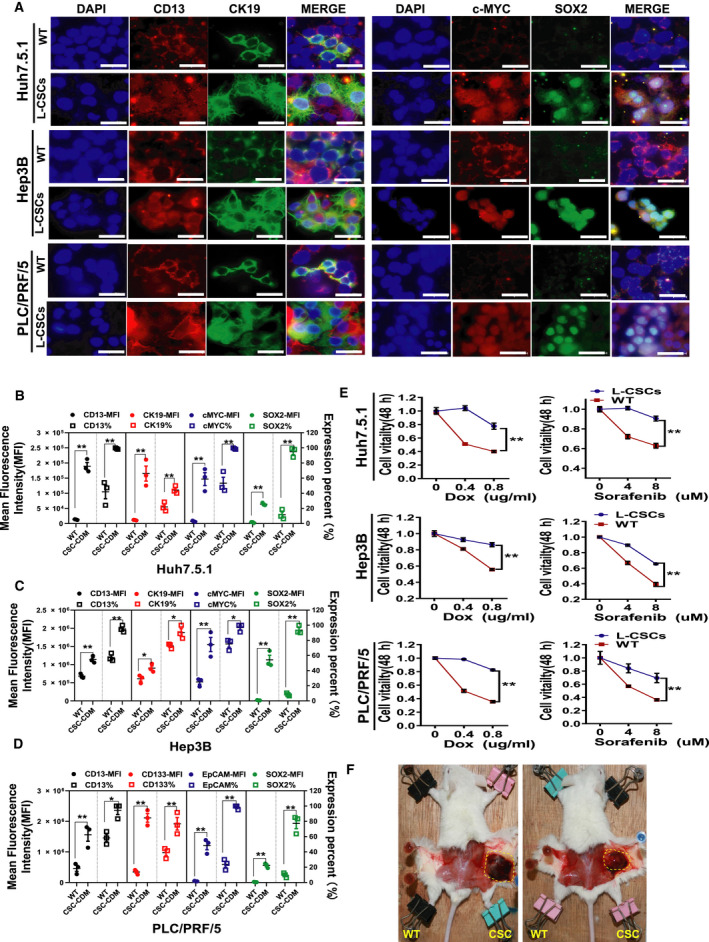
Fig. 4.

The enriched liver CSCs have stronger stemness‐related oncogenes expression, drug resistance and tumorigenicity than those of wild‐type HCC (WT). (A) Immunofluorescent images of CD13, CK19, c‐MYC and SOX2 in three enriched L‐CSCs (CSC‐CDM) or WT. Scale bars: 40 μm (B–D). The histograms of CD13, CK19, c‐MYC and SOX2 expression in three enriched L‐CSCs or wild‐type HCC cells. Mean ± SEM, n = 3. *P < 0.05; **P < 0.01, data analyzed by Student's t‐test. (E) The chemoresistance assay of doxorubicin (Dox) and sorafenib on enriched L‐CSCs or wild‐type HCC. Mean ± SEM, n = 3. *P < 0.05; **P < 0.01, data analyzed by two‐way ANOVA. (F) Gross observation of two mice with tumors derived from Hep3B‐CSCs cultured with CDM. Left flank, wild‐type Hep3B group; right flank, Hep3B‐CSC group; n = 3.
