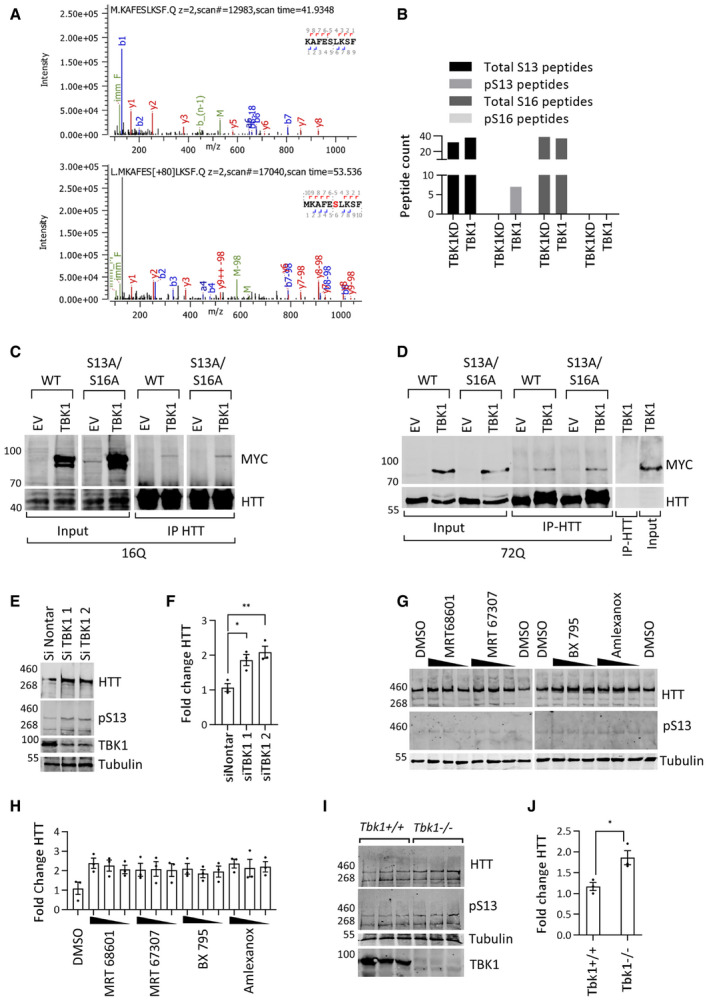
MS/MS spectra of the S13/S16 amino acids containing peptides from HTT immunoprecipitated (IP) from HEK293 cell lysates after coexpression of HTTex1 16Q eGFP with TBK1 KD (upper panel) or TBK1 (lower panel).
Spectral counting of the total WT peptide compared to S13 and S16 peptides from the coexpression with TBK1 or TBK1 KD (n = 1).
Representative Western blot of the indicated kinase (ab‐anti-Myc) from the immunoprecipitation (using anti‐GFP antibody) of HTTex1 16Q eGFP coexpressed with kinase for 48 h in HEK293 cells (n = 3).
Representative Western blot of the indicated kinase (ab‐anti-Myc) from the immunoprecipitation (using anti‐GFP antibody) of HTTex1 72Q eGFP coexpressed with kinase for 48 h in HEK293 cells (n = 3).
Representative Western blot of endogenous HTT (anti‐HTT-D7F7) and HTT pS13 (ab‐CHDI-90001039‐1) after treatment with TBK1 siRNA for 72 h in rat primary striatal neuronal cells.
Quantification of the fold change in HTT normalized to the HTT levels in non‐targeting siRNA normalized to tubulin from the experiments like in E (n = 3).
Representative Western blot of endogenous HTT (ab‐MAB2166) and HTT pS13 (ab‐CHDI-90001039‐1) after treatment with the indicated TBK1 inhibitors (concentrations of 2, 1, and 0.5 μM) for 48 h in rat primary striatal neuronal cells.
Quantification of the fold change in HTT compared to DMSO treatment normalized to tubulin from the experiments like in G (n = 3).
Western blot of HTT (anti‐HTT-D7F7) and HTT pS13 (ab‐CHDI-90001039‐1) levels in cortex tissue lysates from Tbk1
−/− and Tnf‐α
−/− mice (n = 3).
Quantification of the fold change in HTT compared to Tbk1
+/+ normalized to tubulin from I.
Data information: Graph reports mean ± SEM. Significance was assessed using 2‐tailed Student's
‐test, 0.001 to 0.01**, 0.01 to 0.05*.

