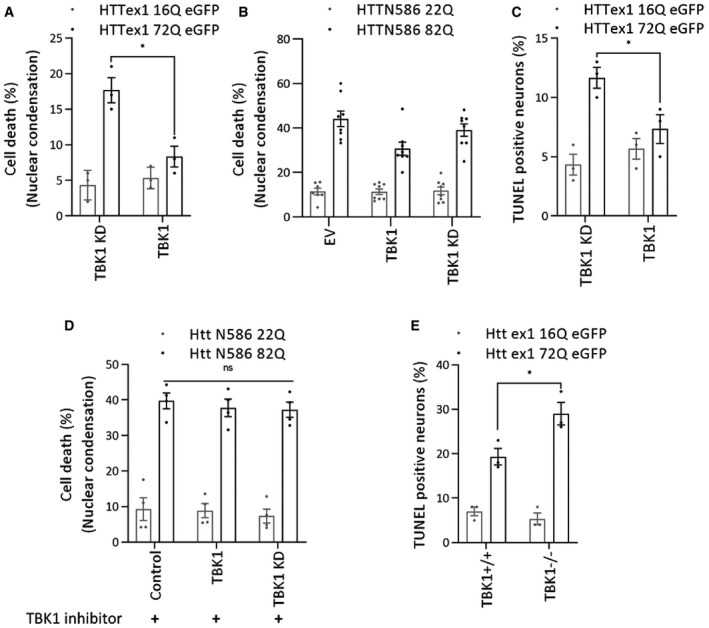
Figure 4. TBK1 expression leads to suppression of mutant HTT induced cytotoxic effects.

-
A, BQuantification of cell death by a nuclear condensation assay, cells were fixed and the nuclei were stained with Hoechst dye, and cells with a nuclear intensity higher than the average intensity plus two standard deviations are considered dead. (A) The percentage of cell death at DIV14, after co‐transfection of indicated kinases and HTTex1 plasmid in rat primary striatal neurons at DIV9 (n = 3), (B) The percentage of cell death at DIV7, after co‐transfection of indicated kinases and HTT N586 plasmid in mouse primary striatal neurons at DIV5 (n = 8).
-
CQuantification of cell death by a TUNEL assay in rat primary striatal neurons transfected with the indicated kinases at DIV9 with the indicated HTT plasmid. The cells were fixed at DIV14, and the percentage of TUNEL‐positive neurons was counted and plotted (n = 3).
-
DThe percentage of cell death, quantification by a nuclear condensation assay in mouse primary cortical neurons co‐transfected with the indicated HTT N586 and kinases at DIV5, and cells were treated with TBK1 inhibitor MRT 68601 at DIV5 till DIV7. Cells were fixed, and the nuclei were stained with Hoechst dye (n = 3). (E) Quantification of cell death by a TUNEL assay in mouse primary striatal neurons transfected with the indicated kinases at DIV9 with the indicated HTT plasmid. The cells were fixed on DIV14, and the percentage of TUNEL‐positive neurons was counted and plotted (n = 3).
