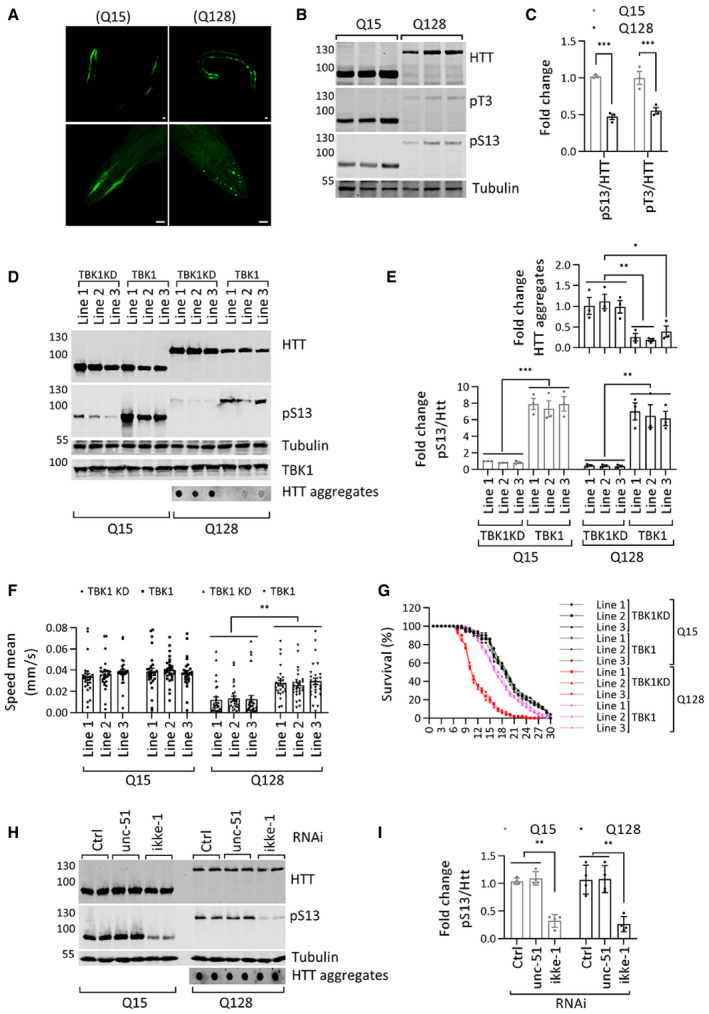
Representative immunofluorescence image of C. elegans overexpressing HTT N513 Q15 and HTT N513 Q128 (scale bar 20 μm). Top panel complete worm, lower panel head region.
Western blot showing HTT (ab‐MAB5492), HTT pS13 (ab‐CHDI-90001039‐1), and HTT pT3 (ab‐CHDI-90001528‐1) levels in C. elegans overexpressing HTT N513 Q15 and HTT N513 Q128.
Quantification of the fold changes in ratios of HTT pS13 and pT3 to total HTT in C. elegans overexpressing HTT N513 Q15 and HTT N513 Q128 from the experiments like in B (n = 3).
Representative Western blots showing the HTT (ab‐MAB5492) and HTT pS13 (ab‐CHDI-90001039‐1) levels from the detergent soluble fraction and HTT aggregates (ab‐MAB5492) from the detergent‐insoluble fraction in three different transgenic C. elegans lines overexpressing TBK1 or the TBK1 KD.
The bottom graph indicates the fold change in the HTT pS13 (ab‐CHDI-90001039‐1) ratios to total HTT (ab‐MAB5492) compared to those in the kinase‐dead mutant line 1 from the experiments like in D. The top graph indicates the fold change in HTT aggregates (ab‐MAB5492) compared to that in the kinase‐dead mutant the experiments like in D (n = 3).
Mobility of the Q15 and Q128 C. elegans lines upon overexpression of TBK1 or TBK1 KD (n = 26–29).
Survival graph of the Q15 and Q128 C. elegans lines upon overexpression of TBK1 or TBK1 KD (n = 30).
Representative Western blots showing HTT (ab‐MAB5492) and HTT pS13 (ab‐CHDI-90001039‐1) from the detergent soluble fraction and HTT aggregates (ab‐MAB5492) from the detergent‐insoluble fraction in TBK1 orthologue (ikke‐1 or unc‐51) RNAi‐treated C. elegans lines expressing HTT N513 Q15 and HTT N513 Q128.
Quantification of the fold change in the ratio of pS13 HTT to total HTT compared to non‐targeting RNAi from the experiments like in H (n = 4).
Data information: Graphs report mean ± SEM. Significance was assessed using 2‐tailed Student's
‐test, < 0.001—except for (F) where 2‐way ANOVA with Sidak post‐hoc test was used. ***0.001 to 0.01**, 0.01 to 0.05*.

