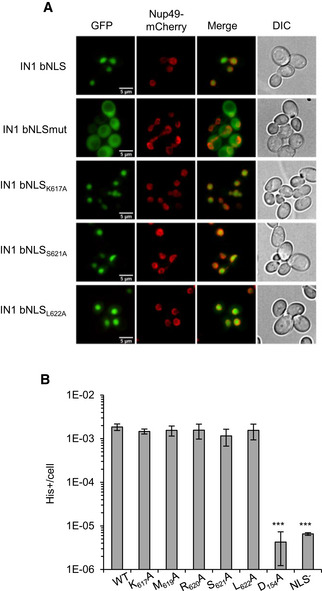
Figure 2. Non‐AC40 binding IN1 mutants do not affect Ty1 integration frequency.

- Localization of GFP2‐IN1 bNLS variants in yeast cells by direct fluorescence microscopy. Nup49‐mCherry signal was used to visualize the location of the nuclear envelope. Corresponding DIC images are shown. Scale bar is 5 μm.
- Retrotransposition frequency (log scale) of pGAL1‐Ty1his3AI bearing the indicated substitutions of conserved residues in a spt3‐101 rad52∆ strain. IN1 catalytic core domain mutant D154A is defective for integration and NLS mutant (KKR628–630GGT) for nuclear import. Values are mean ± SD, n = 4 experiments, each performed with four independent colonies. ***P ≤ 0.001, otherwise not significant (Student t‐test).
Source data are available online for this figure.
