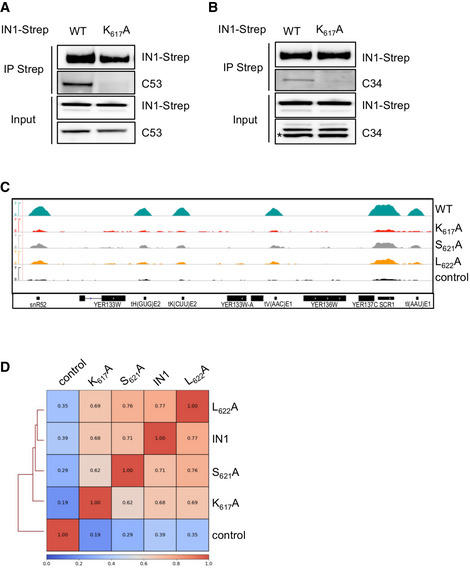
Figure EV2. AC40 recruits IN1 at Pol I‐ and Pol III‐transcribed genes.

-
A, BCo‐immunoprecipitation of endogenous Pol III subunits (C53 and C34) using ectopically expressed Ty1 integrase (IN1‐Strep) as bait. Panels A and B were two separate lysates from two separate co‐IPs. Expected sizes are 53 kDa for C53, 34 kDa for C34 and 82 kDa for IN1‐Strep (WT and K617A mutant). *; C34.
-
CGenome browser visualization of different IN1‐HA occupancy for chromosome V (coordinates chrV:431129..443275). Control is an anti‐HA immunoprecipitation of chromatin extracts in cells expressing IN1‐Strep. The region contains tH(GUG)E2, tK(CUU)E2, tV(ACC)E1, tI(AAU)E1, SNR52, and SCR1, all transcribed by Pol III.
-
DPearson correlation heatmap at tDNAs between the following ChIP‐seq: IN1 WT, K617A, S621A, L622A and control.
Source data are available online for this figure.
