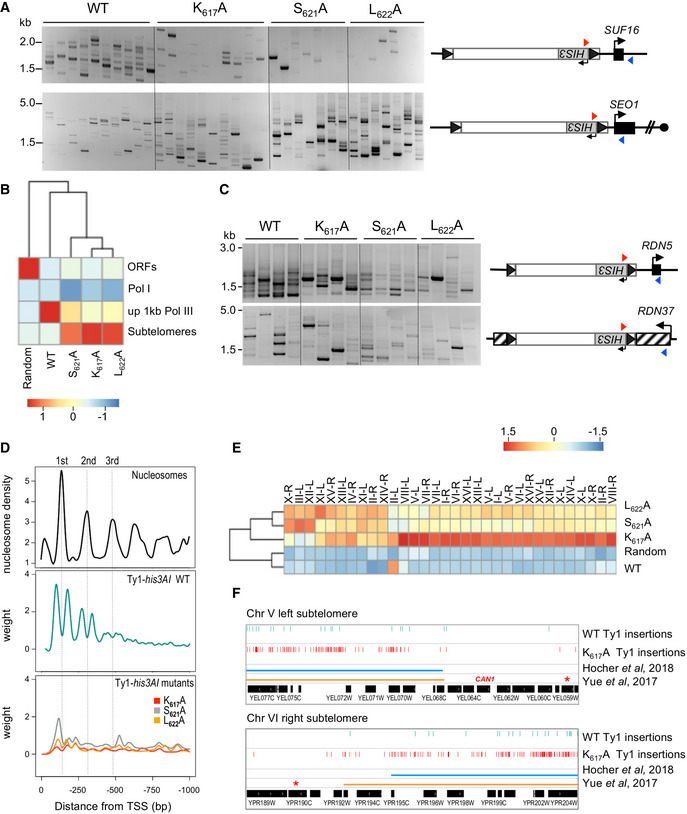
Figure 5. Non‐AC40 binding Ty1 mutants have altered integration profiles.

- Detection of de novo Ty1 insertions upstream of the SUF16 and SEO1 genes by PCR using a primer in HIS3 (red triangle) and a primer in the locus of interest (blue triangle). Ty1 retrotransposition was induced in cells transformed with plasmids expressing WT or mutant (IN1 K617A, S621A, and L622A) Ty1his3AI from the GAL1 promoter. Total genomic DNA was extracted from His+ cells obtained from independent cultures.
- Genome‐wide Ty1 insertion frequencies at each genomic feature are clustered in a heatmap. Score is computed in column Z‐score. ORFs, all Pol II‐transcribed genes except genes at subtelomeres; Pol I, one RDN37 copy; up 1 kb Pol III, 1 kb upstream of all Pol III‐transcribed genes; subtelomeres, genomic coordinates corresponding to chromatin covered by Sir2 and Sir3, when they are co‐overexpressed (Hocher et al, 2018); Random, 100,000 random Ty1 computed insertions in the genome.
- Detection of de novo Ty1 insertions upstream of RDN5 and in RDN37 genes by PCR as described for panel 5A. Four total genomic DNA preparations from panel A were randomly tested by PCR.
- Ty1 insertion profile upstream of tDNAs. Total genomic DNA extracted in (B) was prepared for Ty1 de novo integration event sequencing. Ty1 insertions are computed in a 1 kb window upstream of all the 275 nuclear tDNAs (position 0 in the graph). Each position is divided by the number of insertions at this position (weight). The Smoothing curves indicate the general trend. Nucleosome center positions for the three‐first nucleosomes upstream of all tDNAs are from (Brogaard et al, 2012).
- Ty1 insertion frequencies for each left and right subtelomere of chromosomes are clustered in a heatmap. Score is computed in row Z‐score. Random, as described for panel B. High level of WT Ty1‐HIS3 integration in II‐L is due to the presence of the tRNA gene tF(GAA)B.
- Genome browser visualization of WT and IN1 K617A mutant Ty1‐HIS3 insertions into chromosome V left and chromosome VI right subtelomeres compared to the subtelomere boundaries defined by Hocher et al (2018) and Yue et al (2017), respectively. Red stars indicate the first essential gene of each subtelomere. The CAN1 gene is indicated on chromosome V.
Source data are available online for this figure.
