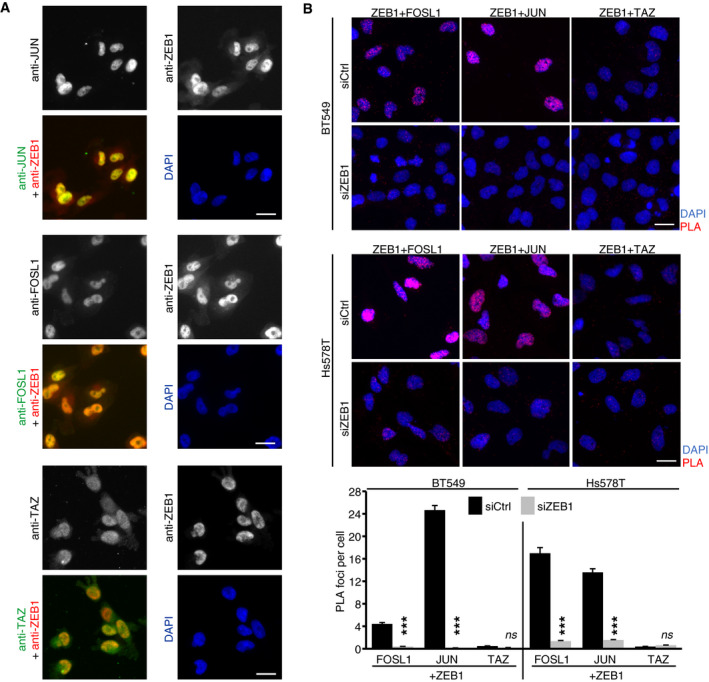
Figure EV2. Proximity ligation assay.

- Immunofluorescence staining of ZEB1, the AP‐1 factors JUN and FOSL1, and the Hippo pathway effector TAZ in MDA‐MB‐231 cells. All four proteins show a clear nuclear localisation. Scale bar = 20 μm.
- In situ proximity ligation assay (PLA) of ZEB1 with JUN, FOSL1 and TAZ shows close proximity of ZEB1 with JUN and FOSL1 but not TAZ in the nucleus of BT549 and Hs578T breast cancer cells indicated by red fluorescent dots. In the upper panel, representative microscopic images are shown. Scale bar = 20 μm. The lower panel shows a quantification of the PLA shown above. n = 2–3; shown is one representative experiment with means ± s.e.m. of at least 900 cells per condition; ***P ≤ 0.001; 2‐way ANOVA plus Tukey′s post‐test.
