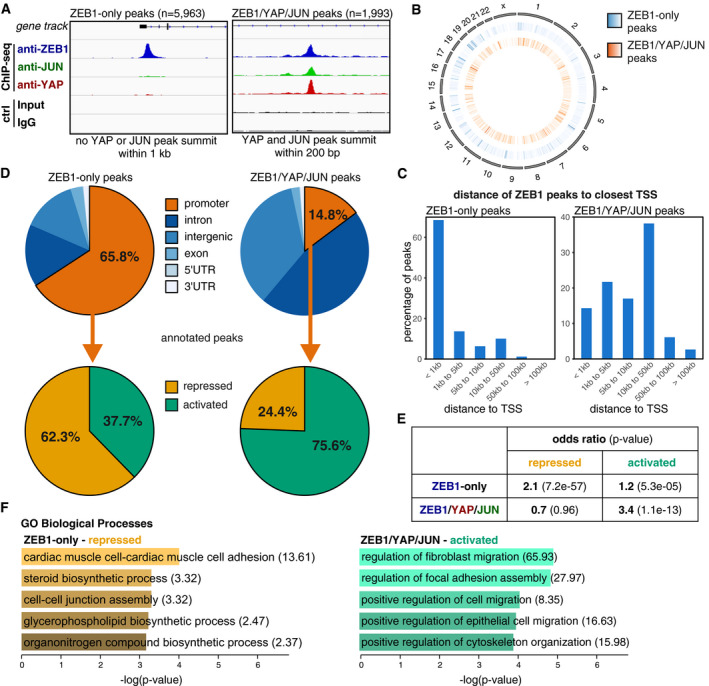
Figure 3. Characterisation of a ZEB1‐only and a ZEB1/YAP/JUN peak set.

- Definition of two different ZEB1 peak subsets based on the presence or absence of overlapping YAP and JUN peaks. The two illustrative genome browser images show one example of a ZEB1‐only peak and one example of a ZEB1/YAP/JUN peak (at the EFEMP1 gene and within the SHROOM3 gene, respectively). Control (ctrl) is the input for ZEB1 and IgG for the YAP and JUN ChIP‐seqs. ChIP‐seqs and respective controls were scaled accordingly.
- Circle plot displaying the genome‐wide distribution of ZEB1‐only (middle circle, blue) and ZEB1/YAP/JUN peaks (inner circle, orange) across all chromosomes (outer circle). Peak density is visualised as a heatmap with more intense colours indicating higher accumulation of peaks at a specific location.
- Localisation of ZEB1 peak summits relative to the closest TSS.
- Distribution of ZEB1‐only and ZEB1/YAP/JUN peaks in respect to different genomic features. Promoters were defined as 1.5 kb upstream to 0.5 kb downstream of the TSS. Promoter peaks were annotated to their respective genes and integrated with transcriptome data of ZEB1 knockdown compared to control MDA‐MB‐231 cells.
- Hypergeometric testing showed that the association of ZEB1‐only promoter peaks with genes repressed in the presence of ZEB1 is stronger than with activated genes, while ZEB1/YAP/JUN promoter peaks are only associated with activated genes. Odds ratio (OR): measure of association between categorical variables with OR > 1 indicating a positive association. P‐value from Fisher's exact test.
- GO term analysis of the ZEB1‐only repressed and ZEB1/YAP/JUN activated gene sets using Enrichr. Odds ratios are given in brackets.
