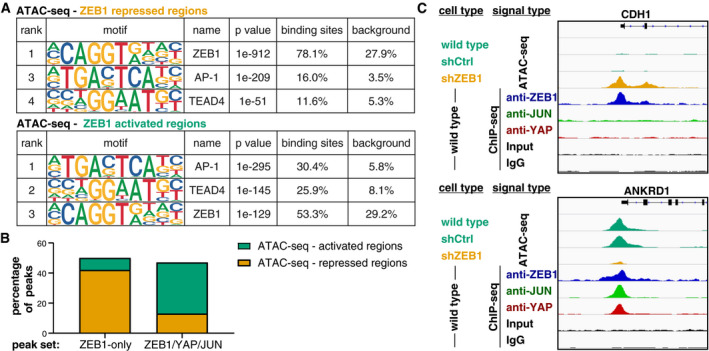
Figure 6. Differential association of ZEB1‐only and ZEB1/YAP/JUN peaks with active and repressed genomic elements.

- Enrichment of the ZEB1, AP‐1 and TEAD4 DNA binding motifs identified by HOMER known motif analysis on 200 bp regions centred on ZEB1 peak summits associated with repressed or activated genomic regions identified by ATAC‐seq. An extended list of the identified motifs can be found in Appendix Tables S6 and S7.
- Comparison of ZEB1 ChIP‐seq peaks with ZEB1‐dependent changes in chromatin activation status identified by ATAC‐seq on control and ZEB1 knockdown MDA‐MB‐231 cells. Percentage of ZEB1‐only (n = 5,963) and ZEB1/YAP/JUN peaks (n = 1,993) falling into ZEB1‐repressed or ZEB1‐activated genomic regions are shown.
- Genome browser tracks of ZEB1, YAP and JUN ChIP‐seq signal intensity in wild‐type cells overlaid to ATAC‐seq signal intensity in wild‐type, control (shCtrl) and ZEB1 (shZEB1) knockdown MDA‐MB‐231 cells. One known ZEB1‐repressed target (CDH1) and one activated target (ANKRD1) are shown.
