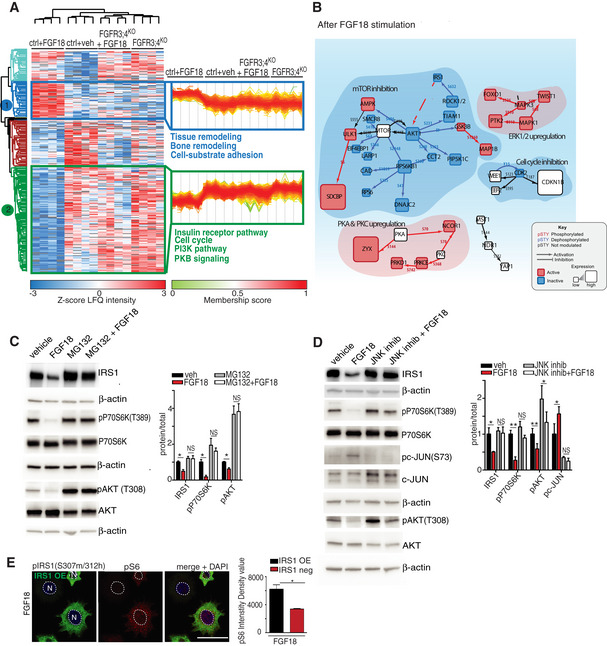
Figure 2. FGF signaling inhibits the insulin/IGF signaling via JNK‐mediated IRS1 degradation.

-
AMS phospho‐proteomics analysis of RCS with indicated genotypes (ctrl = wild type) treated with vehicle (5% ABS) and FGF18 (50 ng/ml) for 16 h, showing biological processes regulated by FGF signaling (in blue: upregulated, in green: downregulated). N = 4 biological replicates were analyzed. FDR < 0.05.
-
BProteomic/phospho‐proteomic signaling network modulated by FGF18 in chondrocytes. Red = activating phosphorylation; blue = inhibitory phosphorylation. Cube dimensions and colors are relative to level of protein regulations.
-
C, DRepresentative Western blot analysis of IRS1, p‐P70S6K (T389), P70S6K, p‐AKT (T308), AKT, p‐c‐JUN (s73), and c‐JUN in RCS chondrocytes treated with vehicle (5% ABS) and FGF18 (50 ng/ml) for 12 h. MG132 (10 μM for 6 h) and JNK inhibitor (50 μM for 12 h) to inhibit proteasome (C) and JNK (D) activity, respectively. β‐actin was used as a loading control. N = 3 independent experiments. Bar graphs showed quantification of indicated proteins normalized to their totals. IRS1 was normalized to β‐actin. Mean ± standard error of the mean (SEM). Student's paired t‐test **P < 0.005; *P < 0.05; NS, not significant.
-
ECo‐immunofluorescence of p‐IRS1 S307 mouse (green) and p‐S6 S240/S242 (red) ribosomal protein in IRS1‐overexpressing RCS chondrocytes treated with FGF18 (50 ng/ml) for 12 h. Nuclei (N) were stained with DAPI (blue). Scale bar 15 μm. Quantification analysis of p‐S6 fluorescence intensity in IRS1‐overexpressing vs non‐expressing RCS chondrocytes. Mean ± standard error of the mean (SEM) of N = 3 biological replicates. n = 35 cells were analyzed. Student's paired t‐test *P < 0.05.
Source data are available online for this figure.
