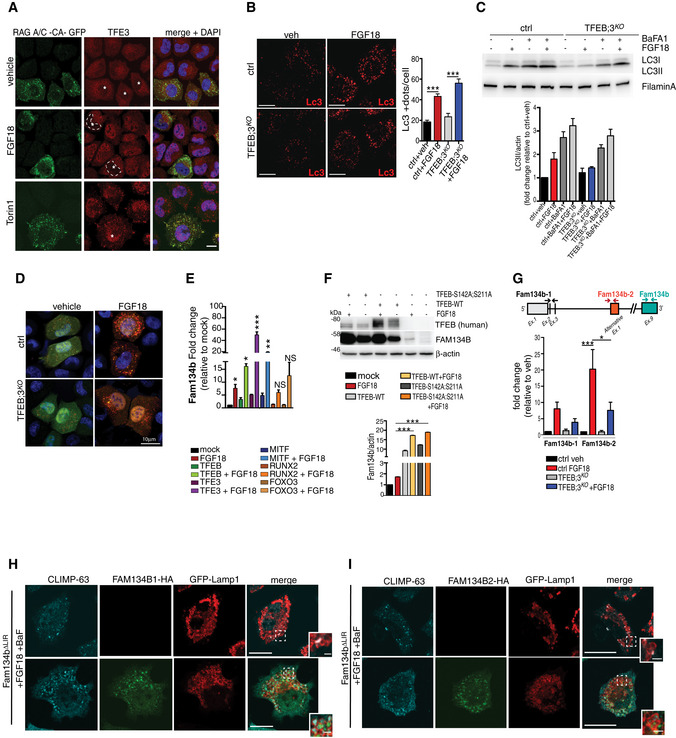
Figure EV3. FGF18 induces Fam134b expression and ER‐phagy.

-
ARepresentative immunofluorescence staining of TFE3 (red) in RAGA/C-CA-GFP (green) overexpressing RCS treated with FGF18 (50 ng/ml overnight) and Torin 1 (1 μM for 2 h). RAGA/C‐CA-GFP overexpressing cells (asterisks) retain TFE3 in the cytoplasm in FGF18 (empty nuclei were highlighted by dashed white lines), but not in Torin 1 treatment. Nuclei were stained with DAPI (blue). Scale bar 10 μm.
-
BRepresentative images of immunofluorescence staining of LC3 protein in wild type (ctrl) and TFEB;3KO RCS treated with vehicle (5% ABS) and FGF18 (50 ng/ml) for 16 h. Scale bar 10 μm. Quantification of LC3‐positive dots/cell. FGF18 was used at 50 ng/ml for 16 h. N = 17 cells/genotypes were analyzed. Student's paired t‐test ***P < 0.005.
-
CWestern blot analysis of LC3B in wild type (ctrl) and TFEB;3KO RCS chondrocytes treated with vehicle (5% ABS) and FGF18 (50 ng/ml) for 12 h. BafA1 (200 nM; 4 h) was used to inhibit lysosome activity. β‐actin was used as a loading control. Blots are representative of N = 4 independent experiments. Bar graph shows quantification of LC3II normalized to β‐actin. Mean ± standard error of the mean (SEM).
-
DRepresentative immunofluorescence staining of mCherry‐GFP-LC3 tandem experiment assay in wild type (ctrl) and TFEB;3KO RCS treated with vehicle (5% ABS) and FGF18 (50 ng/ml) for 12 h. Nuclei were stained with DAPI (blue).
-
EqRT–PCR analysis of Fam134b gene expression in RCS transfected with indicated transcription factors for 48 h. FGF18 (50 ng/ml; 16 h) was added where indicated. Values were normalized to Cyclophilin gene and expressed as fold change relative to mock‐transfected cells. Mean ± standard error of the mean (SEM) of N = 4 biological replicates/treatment. Student's paired t‐test *P < 0.05 and one‐way analysis of variance (ANOVA) P = 0.0001; Tukey's post hoc test ***P < 0.0005; **P < 0.005; NS, not significant.
-
FWestern blot analysis of FAM134B and TFEB proteins in RCS overexpressing TFEB‐WT and TFEB‐S142A:S211 plasmids for 48 h. FGF18 was used at 50 ng/ml for 16 h. β‐actin was used as a loading control. Representative images of N = 3 biological replicates. Bar graph shows quantification of Fam134b normalized to β‐actin. Mean ± standard error of the mean (SEM). Student's paired t‐test ***P < 0.0005.
-
GSchematic representation of Fam134b DNA locus. Arrows indicate the positions qPCR primer pairs used to detect Fam134b‐1 (black arrows), Fam134b‐2 (brown arrows), or both (turquoise arrows) isoforms. qRT–PCR of Fam134b‐1 and Fam134b‐2 isoforms in RCS with indicated genotypes (veh and FGF18 refer to treated wild‐type chondrocytes). FGF18 (50 ng/ml; 16 h) was added where indicated. Values were normalized to Cyclophilin gene and expressed as relative to mock‐transfected cells. Mean ± standard error of the mean (SEM) of N = 4 (Fam134b‐1) and N = 5 (Fam134b‐2) biological replicates/treatment. One‐way analysis of variance (ANOVA) P = 0.0013; Sidak's multiple comparison test ***P < 0.0005; *P < 0.05.
-
H, IImmunofluorescence staining of CLIMP63 (light blue) and lysosomes (GFP‐Lamp1, red) in FAM134bΔLIR RCS chondrocytes transfected with Fam134b‐1 (H) and Fam134b‐2 (I) HA‐tagged (green) plasmids upon FGF18 treatment (50 ng/ml for 16 h). BafA1 (100 nM; 4 h) was used to inhibit lysosomal degradation. Insets show magnification of CLIMP63 accumulation into lysosomes. Scale bar 10 and 2 μm (higher magnification boxes).
Source data are available online for this figure.
