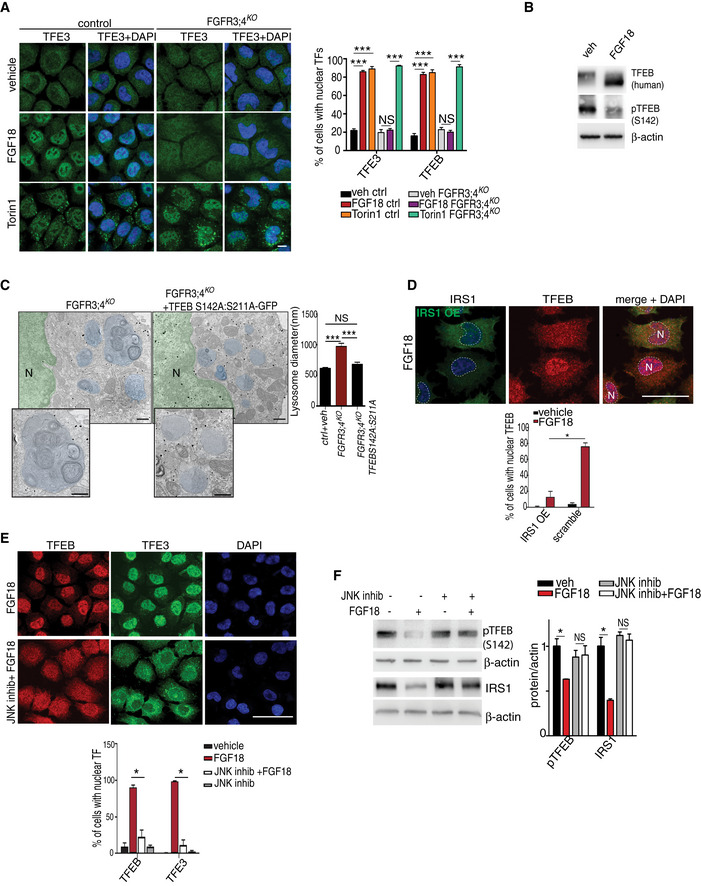
Figure 4. FGF induces nuclear translocation of TFEB/TFE3 transcription factors through JNK‐mediated IRS1 degradation.

- TFE3 (green) subcellular localization in RCS with indicated genotypes (control = wild type) treated with FGF18 (50 ng/ml) for 16 h. Torin 1 (1 μM for 2 h) was used as positive control. Nuclei were stained with DAPI (blue). Bar graph shows quantification (expressed as %) of cells with nuclear TFE3 and TFEB (representative images of TFEB immunofluorescence are shown in Fig EV2E). Mean ± standard error of the mean (SEM) of N = 3 biological replicates; n = 80 (TFE3) and n = 70 (TFEB) cells/experiment were analyzed. Scale bar 10 μm. One‐way analysis of variance (ANOVA) P = 3.23e−12 (TFEB), P = 2.48e−11 (TFE3); Tukey's post hoc test ***P < 0.0005; NS, not significant.
- Western blot analysis of TFEB, and phospho‐TFEB (Serine 142) in RCS chondrocytes stably expressing human TFEB‐3XFlag protein. Cells were treated with vehicle (5% ABS) or FGF18 (50 ng/ml) for 16 h. β‐actin was used as a loading control. Representative images of three independent experiments.
- GFP immuno‐EM staining in FGFR3/4KO chondrocytes infected with a constitutive nuclear (and active) mutant TFEB fused to GFP tag (TFEB‐ S142A:S211A‐GFP). GFP‐positive gold immune particles showed the presence of GFP puncta into the nucleus (N, stained in green for visualization). Lysosomes were stained in blue for visualization. Insets show magnification of lysosomes. Quantification of lysosome diameter (nm) in control (wild type) and FGFR3;4KO chondrocytes infected with empty or with TFEB‐ S142A:S211A‐GFP vector. Mean ± standard error of the mean (SEM) of N = 3 biological replicates. n = 40 (veh), n = 78 (FGFR3;4KO), and n = 57 (FGFR3;4KO +TFEB‐S142A:S211A‐GFP) cells were analyzed. Scale bar 500 nm. Kruskal–Wallis test P = 1.43e−13; Nemenyi post hoc test ***P < 0.0005; NS, not significant.
- Co‐immunofluorescence of IRS1 and TFEB in IRS1‐overexpressing RCS chondrocytes treated with FGF18 (50 ng/ml) for 12 h. Nuclei (N) were stained with DAPI (blue) and delimited with dashed line. Scale bar 15 μm. Quantification of TFEB nuclear localization in IRS1‐overexpressing vs non‐expressing RCS. Mean ± standard error of the mean (SEM) of N = 3 biological replicates. n = 124 cells were analyzed; Student's unpaired t‐test *P < 0.05.
- Subcellular localization analysis of TFEB (red) and TFE3 (green) in RCS chondrocytes treated with FGF18 (50 ng/ml) for 12 h. JNK inhibitor was used at 50 μM for 12 h. Nuclei were stained with DAPI (blue). Quantification analysis showed % of cells with nuclear TFEB and TFE3 in RCS chondrocytes with indicated treatments. Scale bar 15 μm. Mean ± standard error of the mean (SEM) of N = 3 biological replicates. n = 126 cells (control), 126 cells (FGF18), 95 cells (JNK inhibitor), 163 cells (JNK inhibitor + FGF18). Student's paired t‐test *P < 0.05.
- Western blot analysis of phospho‐TFEB (S142) and IRS1 in RCS chondrocytes treated with vehicle (5% ABS) and FGF18 (50 ng/ml) for 12 h. JNK inhibitor was used at 50 μM for 12 h to inhibit kinase activity. β‐actin was used as a loading control. Representative images of N = 3 independent experiments. Bar graphs show quantification of indicated proteins normalized to β‐actin. Mean ± standard error of the mean (SEM). Student's paired t‐test *P < 0.05; NS, not significant.
Source data are available online for this figure.
