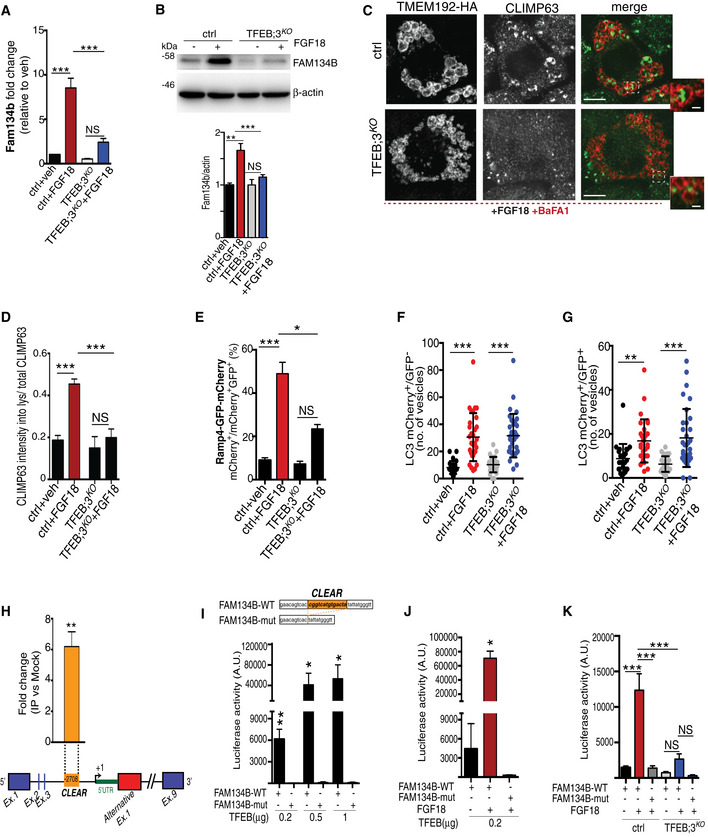
Figure 5. FGF signaling regulates FAM134B transcriptional levels through TFEB and TFE3.

-
AqRT–PCR analysis of Fam134b gene expression in chondrocytes with indicated genotypes (ctrl = wild type) treated with vehicle (5% ABS) or with FGF18 (50 ng/ml; 16 h). Fold change values were relative to vehicle and normalized to Cyclophilin gene. Mean ± standard error of the mean (SEM) of N = 3 biological replicates. One‐way analysis of variance (ANOVA) P < 0.0001: Tukey's post hoc test ***P < 0.0005; NS, not significant.
-
BWestern blot analysis of Fam134b protein in chondrocytes with indicated genotypes treated with vehicle (5% ABS) and FGF18 (50 ng/ml) overnight. β‐actin was used as a loading control. Representative image of N = 3 biological replicates. Bar graph showed quantification of Fam134b normalized to β‐actin. One‐way analysis of variance (ANOVA) P < 0.0001; Sidak's multiple comparison test ***P < 0.0005; **P < 0.005 NS, not significant.
-
CCo‐staining of CLIMP63 (green) and TMEM192‐HA (lysosomes, red) in control and TFEB;3KO RCS treated with FGF18 (50 ng/ml for 16 h). BaFA1 was used at 100 nM for 3 h. Scale bar 15 and 2 μm (higher magnification boxes).
-
DQuantification of CLIMP63 fluorescence intensity into TMEM192‐HA decorated lysosomes. Mean ± standard error of the mean (SEM) of N = 3 biological replicates/treatment/genotype (ctrl = wild type). n = 10 cells/experiment were analyzed. One‐way analysis of variance (ANOVA) P = 1.55e−7; Tukey's post hoc test ***P < 0.0005; NS, not significant.
-
EEATR assay in chondrocytes with indicated genotypes (ctrl = wild type) showing % of cells with acidified ER measured by FACS. FGF18 was used at 50 ng/ml overnight. Mean ± standard error of the mean (SEM) of N = 4 biological replicates. One‐way analysis of variance (ANOVA) P < 0.0001: Tukey's post hoc test ***P < 0.0005; *P < 0.05; NS, not significant.
-
F, GData plots show quantification of mCherry+ vesicles/cell (autolysosomes) (F) and mCherry+/GFP+ vesicles/cell (autophagosomes) (G) in wild type (ctrl) and TFEB;3KO cells treated with vehicle (veh) or FGF18. N = 3 independent experiments. Mean ± standard error of the mean (SEM) of N = 24 (wild type treated with 5%ABS, veh), N = 30 (wild type treated with FGF18), N = 27 (TFEB;3KO veh), N = 33 (TFEB;3KO FGF18) cells. Student's unpaired t‐test ***P < 0.0005; **P < 0.005.
-
HChIP analysis of TFEB binding to Fam134b DNA in RCS cells transfected with TFEB‐3XFLAG. Numbers in the CLEAR site (yellow box) refer to the distance [in base pairs] from the transcriptional start site (+1) of Fam134b‐2 gene. Immunoprecipitated DNA was normalized to the input and plotted as relative enrichment over a mock control. Bar graph shows fold change enrichment; mean ± standard error of the mean (SEM) of N = 3 independent experiments. Student's unpaired t‐test **P < 0.005.
-
I, JLuciferase assays in RCS chondrocytes using as promoter a 0.7 kb genomic Fam134b DNA fragment containing a wild type (FAM134B‐WT) or a deleted (FAM134B‐mut) version of the CLEAR site. TFEB plasmid transfection amount and FGF18 (50 ng/ml for 16 h) treatments are indicated. Mean ± standard error of the mean (SEM) of N = 3 biological replicates. Student's paired t‐test *P < 0.05; **P < 0.005.
-
KLuciferase activity in wild type (ctrl) and TFEB;3KO RCS chondrocytes with indicated genotypes expressing the indicated Fam134b luciferase report plasmids and treated with FGF18 overnight (50 ng/ml) where indicated. Mean ± standard error of the mean (SEM) of N = 5 biological replicates. One‐way analysis of variance (ANOVA) P < 0.0001: Sidak's multiple comparison test ***P < 0.0005; NS, not significant.
Source data are available online for this figure.
