
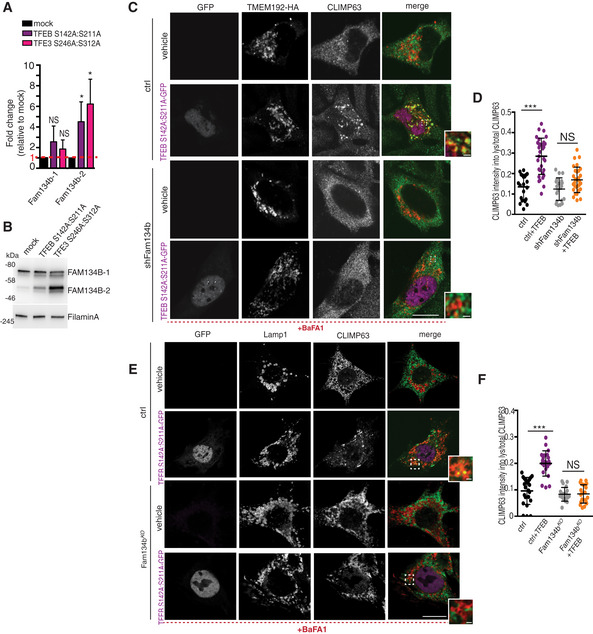
Figure 6. TFEB overexpression induces ER‐phagy in U2OS and MEFs cells via FAM134B.
-
AqRT–PCR analysis of Fam134b isoforms in mock, TFEB S142A:S211A, and TFE3 S246A:S312A overexpressing U2OS cells. Values were normalized to Hprt gene and expressed as fold change values relative to mock. Mean ± standard error of the mean (SEM) of N = 3 biological replicates. Student's unpaired t‐test *P < 0.05; NS, not significant.
-
BWestern blot analysis of Fam134b isoforms in mock, TFEB S142A:S211A, and TFE3 S246A:S312A overexpressing U2OS cells showing induction of FAM134B‐2, but not of FAM134B‐1 isoform by TFEB/TFE3. Filamin A was used as a loading control. Blot is representative of N = 3 independent experiments.
-
C, DCo‐immunofluorescence staining of ER (CLIMP‐63, green) and lysosomes (TMEM192‐HA, red) in control and Sh‐FAM134B U2OS cells overexpressing TFEB S142A:S211A‐GFP (purple). BaFA1 was used at 100 nM for 4 h. Scale bar 15 and 2 μm (higher magnification boxes) (C). In (D), quantification of CLIMP63 fluorescence in TMEM192‐HA decorated lysosomes. Mean ± standard error of the mean (SEM) of N = 3 biological replicates. N = 21 (vehicle ctrl), N = 33 (TFEB S142A:S211A‐GFP ctrl), N = 21 (vehicle shFAM134B), N = 30 (TFEB S142A:S211A‐GFP shFAM134B) cells were analyzed. Student's unpaired t‐test ***P < 0.0005; NS, not significant.
-
E, FCo‐immunofluorescence staining of ER (CLIMP‐63, green) and lysosomes (Lamp1, red) in WT and Fam134bKO MEF cells overexpressing TFEB S142A:S211A‐GFP (purple). BaFA1 was used at 100 nM for 4 h. Scale bar 15 and 2 μm (higher magnification boxes) (E). In (F), quantification of CLIMP63 fluorescence in Lamp1 decorated lysosomes. Mean ± standard error of the mean (SEM) of N = 3 biological replicates. N = 20 (vehicle ctrl), N = 22 (TFEB S142A:S211A‐GFP ctrl), N = 21 (vehicle Fam134bKO), N = 20 (TFEB S142A:S211A‐GFP Fam134bKO) cells were analyzed. Student's unpaired t‐test ***P < 0.0005; NS, not significant.
Source data are available online for this figure.