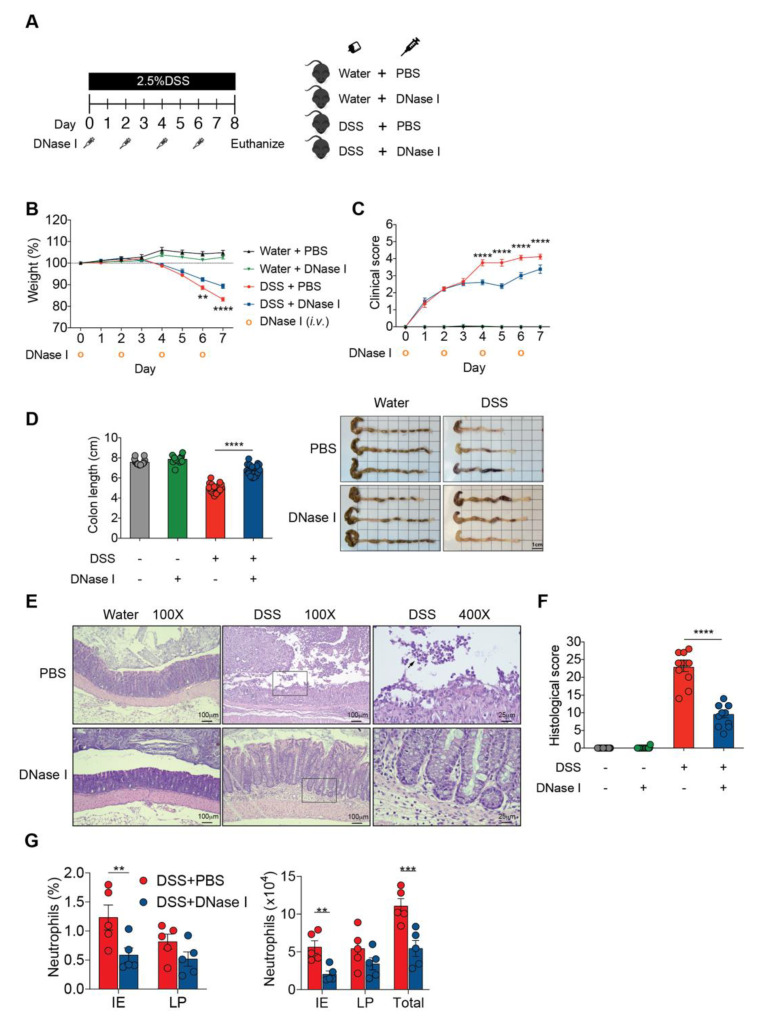
Figure 2.
DNase I treatment attenuates DSS-induced colitis in mice. (A) Schematic overview of the experiment. Colitis was induced by providing 2.5% DSS in the drinking water for 8 d. Clean water was fed to the controls. Phosphate-buffered saline (PBS) or 250 U/dose DNase I was intravenously (i.v.) administered to wild-type C57BL/6 mice every other day, on days 0, 2, 4, and 6. (B,C) Daily weight and total clinical scores of the control or DSS-treated mice after PBS or DNase I treatment. (D) Colon lengths and representative colon images of the control or DSS-treated mice with or without DNase I treatment. (B–D) The results are pooled data from four separate experiments. n = 15 mice per control groups and n = 18 mice per DSS groups. (E) Representative hematoxylin and eosin (H&E) staining of the colon, 400X high-power field (HPF) images are the enlargement of the area outlined in the 100X HPF images. The black arrow indicates neutrophils in the lumen. (F) Histopathology score of the control or DSS-treated mice with or without DNase I treatment. (E,F) The results are pooled data from two separate experiments. n = 9 mice per control groups and n = 12 mice per DSS groups. (G) Percentage and absolute numbers of neutrophils (CD11b + Ly6G+F4/80-) in the intestinal epithelium (IE) and lamina propria (LP) of the colon (Total). n = 5 mice per group. The data represent the mean ± SEM. Statistical analyses were performed using (B–D,F), one-way ANOVA with Turkey’s multiple comparison or (G), an unpaired two-tailed t-test. ** p < 0.01, *** p < 0.001, **** p < 0.0001. Scale bar, 1 cm in (D), 100 µm in 100× pictures and 25 µm in 400× pictures of (E).

