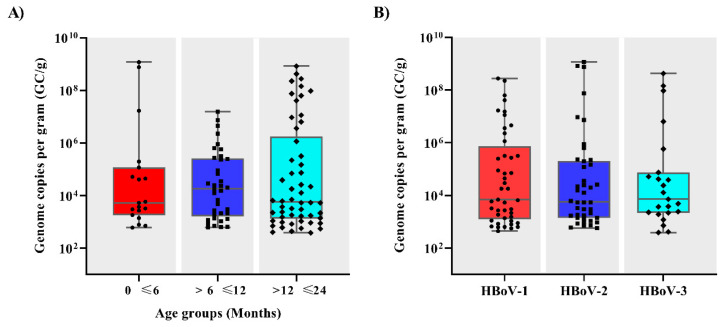
Figure 2.
Human bocavirus (HBoV) viral load expressed as genome copies per gram of stool (GC/g) among different age groups (A) and genotypes (B) in Brazil. Box-and-whisker plots show the first and third quartiles (equivalent to the 5th and 95th percentiles), the median (the horizontal line in the box), and range of HBoV viral load concentrations.

